Join Fund Library now and get free access to personalized features to help you manage your investments.
Sector Equity
 Click for more information on Fundata’s ESG Grade
Click for more information on Fundata’s ESG Grade.
|
Close (05-03-2024) |
$29.86 |
|---|---|
| Change |
$0.48
(1.63%)
|
| Open | $29.66 |
|---|---|
| Day Range | $29.66 - $29.66 |
| Volume | 1,287 |
As at March 31, 2024
As at March 31, 2024
As at February 29, 2024
Inception Return (November 28, 2017): 3.62%
| Row Heading | Return | Annualized Return | ||||||||||||
|---|---|---|---|---|---|---|---|---|---|---|---|---|---|---|
| 1 Mth | 3 Mth | 6 Mth | YTD | 1 Yr | 2 Yr | 3 Yr | 4 Yr | 5 Yr | 6 Yr | 7 Yr | 8 Yr | 9 Yr | 10 Yr | |
| Fund | 2.23% | 11.44% | 28.00% | 11.44% | 24.01% | 2.58% | -2.39% | 13.15% | 8.38% | 4.34% | - | - | - | - |
| Benchmark | 4.14% | 6.62% | 15.26% | 6.62% | 13.96% | 3.95% | 9.11% | 16.99% | 9.96% | 9.65% | 8.48% | 9.70% | 7.76% | 7.67% |
| Category Average | 1.75% | 21.53% | 21.53% | 10.46% | 26.42% | 7.93% | 5.18% | 15.21% | 11.07% | 11.30% | 11.63% | 12.17% | 10.44% | 11.78% |
| Category Rank | 65 / 198 | 69 / 197 | 52 / 193 | 69 / 197 | 82 / 177 | 124 / 159 | 127 / 144 | 63 / 138 | 76 / 127 | 103 / 119 | - | - | - | - |
| Quartile Ranking | 2 | 2 | 2 | 2 | 2 | 4 | 4 | 2 | 3 | 4 | - | - | - | - |
| Return % | Apr | May | Jun | Jul | Aug | Sep | Oct | Nov | Dec | Jan | Feb | Mar |
|---|---|---|---|---|---|---|---|---|---|---|---|---|
| Fund | -2.30% | 10.01% | 4.68% | 1.50% | -8.27% | -7.51% | -8.64% | 16.71% | 7.72% | 0.72% | 8.22% | 2.23% |
| Benchmark | 2.90% | -4.95% | 3.36% | 2.58% | -1.37% | -3.33% | -3.21% | 7.48% | 3.91% | 0.55% | 1.82% | 4.14% |
16.71% (November 2023)
-17.84% (January 2022)
| Return % | 2014 | 2015 | 2016 | 2017 | 2018 | 2019 | 2020 | 2021 | 2022 | 2023 |
|---|---|---|---|---|---|---|---|---|---|---|
| Fund | - | - | - | - | -26.50% | 29.27% | 47.33% | 8.36% | -43.72% | 35.83% |
| Benchmark | 10.55% | -8.32% | 21.08% | 9.10% | -8.89% | 22.88% | 5.60% | 25.09% | -5.84% | 11.75% |
| Category Average | 17.30% | 16.21% | -0.43% | 20.39% | 1.55% | 22.37% | 29.99% | 15.34% | -25.24% | 26.53% |
| Quartile Ranking | - | - | - | - | 4 | 2 | 1 | 3 | 4 | 2 |
| Category Rank | - | - | - | - | 114/ 114 | 37/ 125 | 31/ 135 | 101/ 140 | 134/ 157 | 69/ 168 |
47.33% (2020)
-43.72% (2022)
| Name | Percent |
|---|---|
| International Equity | 54.66 |
| US Equity | 44.06 |
| Canadian Equity | 1.50 |
| Cash and Equivalents | -0.22 |
| Name | Percent |
|---|---|
| Industrial Goods | 50.68 |
| Technology | 31.12 |
| Healthcare | 12.95 |
| Consumer Goods | 1.72 |
| Financial Services | 1.05 |
| Other | 2.48 |
| Name | Percent |
|---|---|
| North America | 45.35 |
| Asia | 35.47 |
| Europe | 16.74 |
| Africa and Middle East | 0.50 |
| Other | 1.94 |
| Name | Percent |
|---|---|
| NVIDIA Corp | 8.88 |
| Intuitive Surgical Inc | 8.14 |
| Abb Ltd - ADR | 8.04 |
| Keyence Corp | 7.89 |
| SMC Corp | 7.45 |
| Yaskawa Electric Corp | 4.65 |
| Fanuc Corp | 4.30 |
| UiPath Inc Cl A | 4.23 |
| Daifuku Co Ltd | 4.16 |
| Dynatrace Inc | 4.15 |


Global X Robotics & AI Index ETF
Median
Other - Sector Equity
| Standard Deviation | 28.72% | 26.82% | - |
|---|---|---|---|
| Beta | 1.49% | 1.17% | - |
| Alpha | -0.13% | -0.01% | - |
| Rsquared | 0.48% | 0.46% | - |
| Sharpe | -0.03% | 0.36% | - |
| Sortino | -0.06% | 0.47% | - |
| Treynor | -0.01% | 0.08% | - |
| Tax Efficiency | - | 98.62% | - |
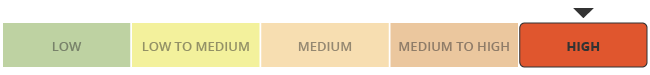
| Volatility |

|
|
- |
| Key Ratio | 1 Yr | 3 Yr | 5 Yr | 10 Yr |
|---|---|---|---|---|
| Standard Deviation | 27.41% | 28.72% | 26.82% | - |
| Beta | 1.19% | 1.49% | 1.17% | - |
| Alpha | 0.09% | -0.13% | -0.01% | - |
| Rsquared | 0.31% | 0.48% | 0.46% | - |
| Sharpe | 0.74% | -0.03% | 0.36% | - |
| Sortino | 1.49% | -0.06% | 0.47% | - |
| Treynor | 0.17% | -0.01% | 0.08% | - |
| Tax Efficiency | 99.80% | - | 98.62% | - |
The E, S, and G scores are averaged for each security in the portfolio, to arrive at an ESG score for each security. We take the portfolio weighted average of the ESG scores for each fund and rank them against their peers to arrive at the Fundata ESG Score from 0-100.
Three scores under the Environment bucket are averaged to yield the Fundata Environment Score for each fund from 0-100: (1) Pollution Prevention, (2) Environmental Transparency, (3) Resource Efficiency.
Six scores under the Social bucket are averaged to yield the Fundata Social Score for each fund from 0-100. (1) Compensation and Satisfaction, (2) Diversity and Rights, (3) Education and Work Conditions, (4) Community and Charity, (5) Human Rights, (6) Sustainability Integration.
Three scores under the governance bucket are averaged to yield the Fundata Governance Score for each fund from 0-100: (1) Board Effectiveness, (2) Management Ethics, (3) Disclosure and Accountability.
Powered by OWL Analytics. For more information, please contact Fundata Canada.
| Start Date | November 28, 2017 |
|---|---|
| Instrument Type | Exchange Traded Fund |
| Share Class | Do-It-Yourself |
| Legal Status | Trust |
| Sales Status | - |
| Currency | CAD |
| Distribution Frequency | No Distribution |
| Assets ($mil) | - |
| 52 Week High | $32.40 |
| 52 Week Low | $21.83 |
| Annual Dividend | $0.03 |
| Annual Yield | - |
| Index | Indxx Global Robotics and Artificial Intelligence Thematic Index |
| Shares Outstanding | - |
| Registered Plan Eligible | Yes |
| Exposure | 1x performance |
|---|---|
| Asset Class High | - |
| Asset Class Medium | - |
| Asset Class Low | - |
| Leveraged | - |
| Inverse | - |
| Advisor Series | - |
| Covered Call Strategy | No |
The ETF seeks to replicate, to the extent possible, the performance of the Indxx Global Robotics & Artificial Intelligence Thematic Index, net of expenses. The Indxx Global Robotics & Artificial Intelligence Thematic Index is designed to provide exposure to the performance of equity securities of companies that are involved in the development of robotics and/or artificial intelligence. The ETF seeks to hedge the U.S. dollar value of its portfolio to the Canadian dollar at all times.
-
| Name | Start Date |
|---|---|
| Horizons ETFs Management (Canada) Inc. | 11-28-2017 |
| Fund Manager | Horizons ETFs Management (Canada) Inc. |
|---|---|
| Advisor | Horizons ETFs Management (Canada) Inc. |
| Custodian | CIBC Mellon Trust Company |
| Registrar | TSX Trust Company |
| Distributor | - |
| Auditor | KPMG LLP |
| MER | 0.64% |
|---|---|
| Management Fee | 0.68% |
Join Fund Library now and get free access to personalized features to help you manage your investments.
 Fund Library