Join Fund Library now and get free access to personalized features to help you manage your investments.
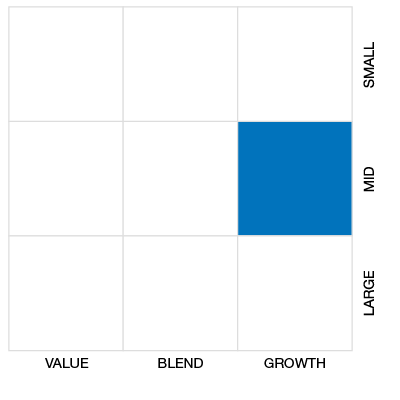
Global Small/Mid Cap Eq
 Click for more information on Fundata’s FundGrade
Click for more information on Fundata’s FundGrade.
 Click for more information on Fundata’s ESG Grade
Click for more information on Fundata’s ESG Grade.
|
NAVPS (06-14-2024) |
$15.10 |
|---|---|
| Change |
-$0.23
(-1.53%)
|
As at May 31, 2024
As at May 31, 2024
As at February 29, 2024
Inception Return (April 16, 2012): 8.61%
| Row Heading | Return | Annualized Return | ||||||||||||
|---|---|---|---|---|---|---|---|---|---|---|---|---|---|---|
| 1 Mth | 3 Mth | 6 Mth | YTD | 1 Yr | 2 Yr | 3 Yr | 4 Yr | 5 Yr | 6 Yr | 7 Yr | 8 Yr | 9 Yr | 10 Yr | |
| Fund | 3.13% | 4.52% | 12.51% | 7.71% | 11.42% | 5.20% | -0.95% | 6.01% | 3.71% | 2.61% | 3.31% | 4.80% | 3.78% | 6.26% |
| Benchmark | 2.98% | 3.56% | 13.33% | 7.33% | 20.50% | 11.43% | 4.54% | 11.13% | 8.64% | 6.46% | 6.99% | 8.50% | 7.31% | 8.65% |
| Category Average | 3.74% | 12.46% | 12.46% | 6.82% | 16.04% | 9.19% | 1.62% | 9.42% | 7.17% | 4.60% | 4.83% | 6.03% | 4.76% | 5.63% |
| Category Rank | 146 / 274 | 109 / 274 | 132 / 271 | 106 / 271 | 201 / 267 | 199 / 242 | 173 / 232 | 173 / 203 | 154 / 181 | 130 / 155 | 118 / 144 | 124 / 137 | 108 / 123 | 64 / 90 |
| Quartile Ranking | 3 | 2 | 2 | 2 | 4 | 4 | 3 | 4 | 4 | 4 | 4 | 4 | 4 | 3 |
| Return % | Jun | Jul | Aug | Sep | Oct | Nov | Dec | Jan | Feb | Mar | Apr | May |
|---|---|---|---|---|---|---|---|---|---|---|---|---|
| Fund | 3.13% | 2.10% | -0.03% | -4.42% | -5.59% | 4.26% | 4.46% | 0.39% | 2.64% | 3.33% | -1.91% | 3.13% |
| Benchmark | 4.01% | 4.07% | -0.53% | -4.79% | -3.18% | 7.14% | 5.59% | -1.54% | 5.26% | 3.87% | -3.18% | 2.98% |
13.37% (November 2020)
-18.26% (March 2020)
| Return % | 2014 | 2015 | 2016 | 2017 | 2018 | 2019 | 2020 | 2021 | 2022 | 2023 |
|---|---|---|---|---|---|---|---|---|---|---|
| Fund | 17.44% | 20.97% | 0.97% | 9.72% | -6.30% | 19.97% | 4.73% | 11.86% | -17.90% | 5.36% |
| Benchmark | 9.59% | 16.61% | 7.47% | 15.40% | -7.34% | 20.09% | 11.07% | 15.50% | -13.14% | 14.59% |
| Category Average | 6.30% | 9.56% | 3.48% | 12.62% | -10.42% | 13.76% | 14.53% | 12.37% | -15.59% | 12.82% |
| Quartile Ranking | 1 | 2 | 3 | 3 | 2 | 2 | 4 | 3 | 3 | 4 |
| Category Rank | 6/ 88 | 42/ 108 | 91/ 137 | 103/ 142 | 43/ 152 | 56/ 178 | 151/ 184 | 164/ 219 | 170/ 241 | 227/ 257 |
20.97% (2015)
-17.90% (2022)
| Name | Percent |
|---|---|
| US Equity | 51.25 |
| International Equity | 40.54 |
| Canadian Equity | 6.94 |
| Canadian Corporate Bonds | 0.99 |
| Cash and Equivalents | 0.28 |
| Name | Percent |
|---|---|
| Financial Services | 14.05 |
| Real Estate | 11.76 |
| Healthcare | 11.70 |
| Consumer Services | 11.65 |
| Industrial Services | 11.57 |
| Other | 39.27 |
| Name | Percent |
|---|---|
| North America | 59.32 |
| Europe | 32.96 |
| Asia | 3.31 |
| Latin America | 2.84 |
| Africa and Middle East | 1.59 |
| Other | -0.02 |
| Name | Percent |
|---|---|
| Ringkjoebing Landbobank A/S | 4.24 |
| Kirby Corp | 3.51 |
| Boot Barn Holdings Inc | 3.28 |
| WSP Global Inc | 2.81 |
| Graphic Packaging Holding Co | 2.75 |
| Wheaton Precious Metals Corp | 2.66 |
| Storebrand ASA | 2.57 |
| Encompass Health Corp | 2.32 |
| Eagle Materials Inc | 2.19 |
| Molina Healthcare Inc | 2.17 |

BMO Global Small Cap Fund Series A
Median
Other - Global Small/Mid Cap Eq
| Standard Deviation | 14.00% | 17.18% | 14.79% |
|---|---|---|---|
| Beta | 0.87% | 1.00% | 0.99% |
| Alpha | -0.05% | -0.05% | -0.02% |
| Rsquared | 0.87% | 0.92% | 0.90% |
| Sharpe | -0.21% | 0.18% | 0.39% |
| Sortino | -0.29% | 0.17% | 0.40% |
| Treynor | -0.03% | 0.03% | 0.06% |
| Tax Efficiency | - | 88.81% | 79.93% |
| Volatility |

|

|
|

| Key Ratio | 1 Yr | 3 Yr | 5 Yr | 10 Yr |
|---|---|---|---|---|
| Standard Deviation | 11.62% | 14.00% | 17.18% | 14.79% |
| Beta | 0.77% | 0.87% | 1.00% | 0.99% |
| Alpha | -0.04% | -0.05% | -0.05% | -0.02% |
| Rsquared | 0.86% | 0.87% | 0.92% | 0.90% |
| Sharpe | 0.57% | -0.21% | 0.18% | 0.39% |
| Sortino | 1.09% | -0.29% | 0.17% | 0.40% |
| Treynor | 0.09% | -0.03% | 0.03% | 0.06% |
| Tax Efficiency | 100.00% | - | 88.81% | 79.93% |
The E, S, and G scores are averaged for each security in the portfolio, to arrive at an ESG score for each security. We take the portfolio weighted average of the ESG scores for each fund and rank them against their peers to arrive at the Fundata ESG Score from 0-100.
Three scores under the Environment bucket are averaged to yield the Fundata Environment Score for each fund from 0-100: (1) Pollution Prevention, (2) Environmental Transparency, (3) Resource Efficiency.
Six scores under the Social bucket are averaged to yield the Fundata Social Score for each fund from 0-100. (1) Compensation and Satisfaction, (2) Diversity and Rights, (3) Education and Work Conditions, (4) Community and Charity, (5) Human Rights, (6) Sustainability Integration.
Three scores under the governance bucket are averaged to yield the Fundata Governance Score for each fund from 0-100: (1) Board Effectiveness, (2) Management Ethics, (3) Disclosure and Accountability.
Powered by OWL Analytics. For more information, please contact Fundata Canada.
| Start Date | April 16, 2012 |
|---|---|
| Instrument Type | Mutual Fund |
| Share Class | Commission Based Advice |
| Legal Status | Trust |
| Sales Status | Open |
| Currency | CAD |
| Distribution Frequency | Annual |
| Assets ($mil) | $129 |
| FundServ Code | Load Code | Sales Status |
|---|---|---|
| BMO151 | ||
| BMO70151 |
This fund’s objective is to provide long-term growth through capital appreciation by investing primarily in equities and equity-related securities of companies with small to medium market capitalization located throughout the world.
These are the strategies the portfolio manager uses to try to achieve the fund’s objective: invests in global smaller capitalization companies; employs a disciplined bottom up investing approach focused on assessing quality value and risk to identify high quality businesses with competitive advantages, strong management and superior earnings growth.
| Name | Start Date |
|---|---|
| Catherine Stanley | 05-30-2023 |
| Patrick Newens | 05-30-2023 |
| Fund Manager | BMO Investments Inc. |
|---|---|
| Advisor | Columbia Threadneedle Management Limited |
| Custodian | State Street Trust Company Canada |
| Registrar | BMO Investments Inc. |
| Distributor | BMO Investments Inc. |
| Auditor | PriceWaterhouseCoopers LLP |
| RSP Eligible | Yes |
|---|---|
| PAC Allowed | Yes |
| PAC Initial Investment | 50 |
| PAC Subsequent | 50 |
| SWP Allowed | Yes |
| SWP Min Balance | 5,000 |
| SWP Min Withdrawal | 100 |
| MER | 2.57% |
|---|---|
| Management Fee | 2.25% |
| Load | No Load |
| FE Max | - |
| DSC Max | - |
| Trailer Fee Max (FE) | - |
| Trailer Fee Max (DSC) | - |
| Trailer Fee Max (NL) | 1.00% |
| Trailer Fee Max (LL) | - |
Join Fund Library now and get free access to personalized features to help you manage your investments.
 Fund Library