Join Fund Library now and get free access to personalized features to help you manage your investments.
Global Equity
 Click for more information on Fundata’s FundGrade
Click for more information on Fundata’s FundGrade.
 Click for more information on Fundata’s ESG Grade
Click for more information on Fundata’s ESG Grade.
|
NAVPS (05-03-2024) |
$10.83 |
|---|---|
| Change |
$0.12
(1.10%)
|
As at March 31, 2024
As at February 29, 2024
As at February 29, 2024
Inception Return (May 30, 1995): 4.07%
| Row Heading | Return | Annualized Return | ||||||||||||
|---|---|---|---|---|---|---|---|---|---|---|---|---|---|---|
| 1 Mth | 3 Mth | 6 Mth | YTD | 1 Yr | 2 Yr | 3 Yr | 4 Yr | 5 Yr | 6 Yr | 7 Yr | 8 Yr | 9 Yr | 10 Yr | |
| Fund | 2.80% | 5.74% | 17.72% | 5.74% | 11.11% | -3.01% | -6.84% | 2.91% | -0.15% | 0.08% | 1.28% | 2.64% | 1.90% | 2.81% |
| Benchmark | 2.94% | 10.27% | 20.07% | 10.27% | 23.05% | 11.13% | 9.29% | 15.98% | 11.08% | 10.21% | 10.43% | 11.39% | 9.83% | 10.93% |
| Category Average | 2.78% | 18.53% | 18.53% | 9.49% | 18.77% | 8.26% | 6.74% | 13.89% | 8.87% | 8.06% | 8.20% | 8.89% | 7.44% | 8.02% |
| Category Rank | 1,035 / 2,078 | 1,890 / 2,054 | 1,095 / 2,008 | 1,890 / 2,054 | 1,780 / 1,936 | 1,789 / 1,805 | 1,638 / 1,645 | 1,508 / 1,508 | 1,448 / 1,448 | 1,231 / 1,231 | 1,065 / 1,069 | 923 / 923 | 783 / 786 | 703 / 715 |
| Quartile Ranking | 2 | 4 | 3 | 4 | 4 | 4 | 4 | 4 | 4 | 4 | 4 | 4 | 4 | 4 |
| Return % | Apr | May | Jun | Jul | Aug | Sep | Oct | Nov | Dec | Jan | Feb | Mar |
|---|---|---|---|---|---|---|---|---|---|---|---|---|
| Fund | -1.76% | 0.17% | 2.27% | 3.36% | -2.62% | -6.81% | -4.20% | 10.15% | 5.49% | -1.16% | 4.07% | 2.80% |
| Benchmark | 1.71% | -0.97% | 2.98% | 3.28% | -0.19% | -4.15% | -0.71% | 6.95% | 2.53% | 1.41% | 5.64% | 2.94% |
11.60% (January 2023)
-14.22% (April 2022)
| Return % | 2014 | 2015 | 2016 | 2017 | 2018 | 2019 | 2020 | 2021 | 2022 | 2023 |
|---|---|---|---|---|---|---|---|---|---|---|
| Fund | 6.69% | 12.10% | 3.97% | 12.56% | -5.73% | 11.37% | 16.88% | 7.31% | -38.57% | 17.95% |
| Benchmark | 13.97% | 16.88% | 5.18% | 16.29% | -1.79% | 21.41% | 13.15% | 17.62% | -12.64% | 19.37% |
| Category Average | 8.33% | 8.98% | 3.86% | 14.23% | -5.38% | 19.94% | 11.73% | 16.21% | -13.86% | 15.08% |
| Quartile Ranking | 4 | 3 | 3 | 3 | 3 | 4 | 1 | 4 | 4 | 2 |
| Category Rank | 573/ 686 | 471/ 768 | 448/ 892 | 657/ 1,062 | 713/ 1,212 | 1,321/ 1,417 | 339/ 1,500 | 1,532/ 1,620 | 1,763/ 1,774 | 618/ 1,933 |
17.95% (2023)
-38.57% (2022)
| Name | Percent |
|---|---|
| International Equity | 51.44 |
| US Equity | 45.12 |
| Canadian Equity | 2.32 |
| Cash and Equivalents | 1.13 |
| Other | -0.01 |
| Name | Percent |
|---|---|
| Technology | 25.81 |
| Industrial Goods | 19.20 |
| Healthcare | 13.36 |
| Industrial Services | 11.27 |
| Consumer Services | 8.91 |
| Other | 21.45 |
| Name | Percent |
|---|---|
| North America | 48.57 |
| Europe | 32.47 |
| Asia | 15.28 |
| Latin America | 3.69 |
| Other | -0.01 |
| Name | Percent |
|---|---|
| Mercadolibre Inc | 3.69 |
| Taiwan Semiconductor Manufactrg Co Ltd | 3.35 |
| Atlas Copco AB Cl B | 3.23 |
| Illumina Inc | 3.17 |
| Spotify Technology SA | 3.11 |
| Beijer Ref AB (publ) Cl B | 3.09 |
| Workday Inc Cl A | 2.94 |
| Mastercard Inc Cl A | 2.83 |
| NVIDIA Corp | 2.78 |
| UnitedHealth Group Inc | 2.62 |


NEI Global Growth Fund Series A
Median
Other - Global Equity
| Standard Deviation | 20.33% | 18.30% | 14.81% |
|---|---|---|---|
| Beta | 1.41% | 1.22% | 1.14% |
| Alpha | -0.19% | -0.12% | -0.09% |
| Rsquared | 0.79% | 0.80% | 0.82% |
| Sharpe | -0.38% | -0.02% | 0.17% |
| Sortino | -0.51% | -0.11% | 0.08% |
| Treynor | -0.05% | 0.00% | 0.02% |
| Tax Efficiency | - | - | 46.63% |
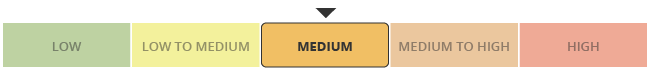
| Volatility |

|

|

|
| Key Ratio | 1 Yr | 3 Yr | 5 Yr | 10 Yr |
|---|---|---|---|---|
| Standard Deviation | 16.11% | 20.33% | 18.30% | 14.81% |
| Beta | 1.39% | 1.41% | 1.22% | 1.14% |
| Alpha | -0.18% | -0.19% | -0.12% | -0.09% |
| Rsquared | 0.81% | 0.79% | 0.80% | 0.82% |
| Sharpe | 0.44% | -0.38% | -0.02% | 0.17% |
| Sortino | 0.96% | -0.51% | -0.11% | 0.08% |
| Treynor | 0.05% | -0.05% | 0.00% | 0.02% |
| Tax Efficiency | 100.00% | - | - | 46.63% |
The E, S, and G scores are averaged for each security in the portfolio, to arrive at an ESG score for each security. We take the portfolio weighted average of the ESG scores for each fund and rank them against their peers to arrive at the Fundata ESG Score from 0-100.
Three scores under the Environment bucket are averaged to yield the Fundata Environment Score for each fund from 0-100: (1) Pollution Prevention, (2) Environmental Transparency, (3) Resource Efficiency.
Six scores under the Social bucket are averaged to yield the Fundata Social Score for each fund from 0-100. (1) Compensation and Satisfaction, (2) Diversity and Rights, (3) Education and Work Conditions, (4) Community and Charity, (5) Human Rights, (6) Sustainability Integration.
Three scores under the governance bucket are averaged to yield the Fundata Governance Score for each fund from 0-100: (1) Board Effectiveness, (2) Management Ethics, (3) Disclosure and Accountability.
Powered by OWL Analytics. For more information, please contact Fundata Canada.
| Start Date | May 30, 1995 |
|---|---|
| Instrument Type | Mutual Fund (Responsible Investment) |
| Share Class | Commission Based Advice |
| Legal Status | Trust |
| Sales Status | Open |
| Currency | CAD |
| Distribution Frequency | Annual |
| Assets ($mil) | $321 |
| FundServ Code | Load Code | Sales Status |
|---|---|---|
| NWT10211 | ||
| NWT10311 | ||
| NWT110 | ||
| NWT610 | ||
| NWT810 |
The NEI Global Growth Fund seeks to achieve long-term growth by investing in a global portfolio of equities, which include common stock and other equity securities of issuers located in countries throughout developed and emerging markets. The NEI Global Growth Fund follows a responsible approach to investing, as described on pages 74 to 79 of this prospectus.
To achieve its objectives, the Fund invests primarily in equity securities either directly or indirectly, from issuers around the world, across a range of industries. The portfolio sub-advisor employs a bottom-up, benchmark unconstrained approach to security selection and selects companies that demonstrate sustainable growth prospects and good stewardship that it believes will deliver above average returns over the long term.
| Name | Start Date |
|---|---|
| Northwest & Ethical Investments L.P. | 07-08-2010 |
| Gary Robinson | 11-15-2021 |
| Zaki Sabir | 11-15-2021 |
| Craig Noble | 11-15-2021 |
| Katherine Davidson | 04-01-2022 |
| Toby Ross | 01-01-2023 |
| Fund Manager | Northwest & Ethical Investments L.P. |
|---|---|
| Advisor | Northwest & Ethical Investments L.P. |
| Custodian | Desjardins Trust Inc. |
| Registrar | Northwest & Ethical Investments L.P. |
| Distributor | Credential Asset Management Inc. |
| Auditor | Ernst & Young LLP |
| RSP Eligible | Yes |
|---|---|
| PAC Allowed | Yes |
| PAC Initial Investment | 500 |
| PAC Subsequent | 25 |
| SWP Allowed | Yes |
| SWP Min Balance | 5,000 |
| SWP Min Withdrawal | 100 |
| MER | 2.18% |
|---|---|
| Management Fee | 1.75% |
| Load | Choice of Front or No Load |
| FE Max | 5.00% |
| DSC Max | 6.00% |
| Trailer Fee Max (FE) | 1.00% |
| Trailer Fee Max (DSC) | 0.50% |
| Trailer Fee Max (NL) | - |
| Trailer Fee Max (LL) | - |
Join Fund Library now and get free access to personalized features to help you manage your investments.
 Fund Library