Join Fund Library now and get free access to personalized features to help you manage your investments.
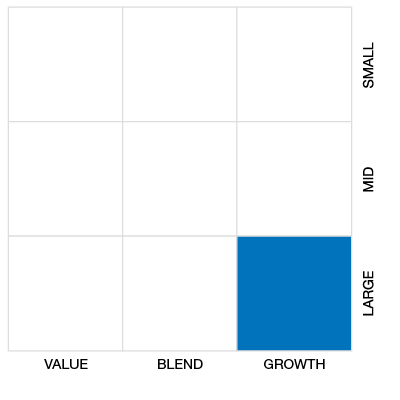
Sector Equity
 Click for more information on Fundata’s ESG Grade
Click for more information on Fundata’s ESG Grade.
|
Close (05-17-2024) |
$46.85 |
|---|---|
| Change |
-$0.04
(-0.09%)
|
| Open | $46.71 |
|---|---|
| Day Range | $46.71 - $46.94 |
| Volume | 951 |
As at April 30, 2024
As at April 30, 2024
As at February 29, 2024
Inception Return (September 18, 2017): 13.33%
| Row Heading | Return | Annualized Return | ||||||||||||
|---|---|---|---|---|---|---|---|---|---|---|---|---|---|---|
| 1 Mth | 3 Mth | 6 Mth | YTD | 1 Yr | 2 Yr | 3 Yr | 4 Yr | 5 Yr | 6 Yr | 7 Yr | 8 Yr | 9 Yr | 10 Yr | |
| Fund | -4.52% | -2.95% | 22.90% | 1.63% | 40.41% | 4.00% | -0.08% | 11.93% | 9.55% | 11.35% | - | - | - | - |
| Benchmark | -1.82% | 4.10% | 16.91% | 4.68% | 8.73% | 5.66% | 7.59% | 13.51% | 8.86% | 8.98% | 8.12% | 8.95% | 7.25% | 7.22% |
| Category Average | -3.74% | 20.47% | 20.47% | 6.33% | 21.51% | 11.00% | 2.93% | 10.99% | 9.65% | 10.68% | 10.35% | 12.02% | 10.29% | 11.57% |
| Category Rank | 140 / 190 | 172 / 189 | 74 / 189 | 146 / 189 | 34 / 171 | 120 / 155 | 95 / 137 | 49 / 130 | 50 / 123 | 34 / 111 | - | - | - | - |
| Quartile Ranking | 3 | 4 | 2 | 4 | 1 | 4 | 3 | 2 | 2 | 2 | - | - | - | - |
| Return % | May | Jun | Jul | Aug | Sep | Oct | Nov | Dec | Jan | Feb | Mar | Apr |
|---|---|---|---|---|---|---|---|---|---|---|---|---|
| Fund | 13.36% | 1.74% | 5.29% | -1.74% | -2.59% | -1.71% | 11.69% | 8.27% | 4.72% | 4.94% | -3.14% | -4.52% |
| Benchmark | -4.95% | 3.36% | 2.58% | -1.37% | -3.33% | -3.21% | 7.48% | 3.91% | 0.55% | 1.82% | 4.14% | -1.82% |
16.37% (December 2020)
-12.04% (January 2022)
| Return % | 2014 | 2015 | 2016 | 2017 | 2018 | 2019 | 2020 | 2021 | 2022 | 2023 |
|---|---|---|---|---|---|---|---|---|---|---|
| Fund | - | - | - | - | 9.01% | 24.68% | 65.60% | 5.71% | -36.63% | 43.31% |
| Benchmark | 10.55% | -8.32% | 21.08% | 9.10% | -8.89% | 22.88% | 5.60% | 25.09% | -5.84% | 11.75% |
| Category Average | 17.30% | 16.21% | -0.43% | 20.39% | 1.55% | 22.37% | 29.99% | 15.34% | -25.24% | 26.53% |
| Quartile Ranking | - | - | - | - | 1 | 2 | 1 | 4 | 4 | 2 |
| Category Rank | - | - | - | - | 17/ 106 | 49/ 117 | 22/ 127 | 106/ 132 | 112/ 149 | 43/ 161 |
65.60% (2020)
-36.63% (2022)
| Name | Percent |
|---|---|
| US Equity | 68.27 |
| International Equity | 30.27 |
| Canadian Equity | 1.06 |
| Cash and Equivalents | 0.40 |
| Name | Percent |
|---|---|
| Technology | 92.18 |
| Industrial Services | 6.95 |
| Cash and Cash Equivalent | 0.40 |
| Financial Services | 0.21 |
| Other | 0.26 |
| Name | Percent |
|---|---|
| North America | 69.68 |
| Africa and Middle East | 13.91 |
| Asia | 11.55 |
| Europe | 4.61 |
| Other | 0.25 |
| Name | Percent |
|---|---|
| Palo Alto Networks Inc | 7.86 |
| Booz Allen Hamilton Holding Corp Cl A | 7.73 |
| Zscaler Inc | 7.19 |
| Fortinet Inc | 7.18 |
| Okta Inc Cl A | 7.15 |
| Crowdstrike Holdings Inc Cl A | 7.15 |
| Check Point Software Technologies Ltd | 6.95 |
| Cyberark Software Ltd | 6.51 |
| CACI International Inc Cl A | 5.78 |
| Trend Micro Inc | 4.52 |

Evolve Cyber Security Index Fund (CYBR) - Hedged
Median
Other - Sector Equity
| Standard Deviation | 22.25% | 23.93% | - |
|---|---|---|---|
| Beta | 0.67% | 0.75% | - |
| Alpha | -0.03% | 0.05% | - |
| Rsquared | 0.16% | 0.24% | - |
| Sharpe | -0.02% | 0.42% | - |
| Sortino | -0.04% | 0.60% | - |
| Treynor | -0.01% | 0.13% | - |
| Tax Efficiency | - | 98.85% | - |
| Volatility |

|
|
- |

| Key Ratio | 1 Yr | 3 Yr | 5 Yr | 10 Yr |
|---|---|---|---|---|
| Standard Deviation | 20.74% | 22.25% | 23.93% | - |
| Beta | 0.45% | 0.67% | 0.75% | - |
| Alpha | 0.32% | -0.03% | 0.05% | - |
| Rsquared | 0.08% | 0.16% | 0.24% | - |
| Sharpe | 1.52% | -0.02% | 0.42% | - |
| Sortino | 4.71% | -0.04% | 0.60% | - |
| Treynor | 0.70% | -0.01% | 0.13% | - |
| Tax Efficiency | 99.64% | - | 98.85% | - |
The E, S, and G scores are averaged for each security in the portfolio, to arrive at an ESG score for each security. We take the portfolio weighted average of the ESG scores for each fund and rank them against their peers to arrive at the Fundata ESG Score from 0-100.
Three scores under the Environment bucket are averaged to yield the Fundata Environment Score for each fund from 0-100: (1) Pollution Prevention, (2) Environmental Transparency, (3) Resource Efficiency.
Six scores under the Social bucket are averaged to yield the Fundata Social Score for each fund from 0-100. (1) Compensation and Satisfaction, (2) Diversity and Rights, (3) Education and Work Conditions, (4) Community and Charity, (5) Human Rights, (6) Sustainability Integration.
Three scores under the governance bucket are averaged to yield the Fundata Governance Score for each fund from 0-100: (1) Board Effectiveness, (2) Management Ethics, (3) Disclosure and Accountability.
Powered by OWL Analytics. For more information, please contact Fundata Canada.
| Start Date | September 18, 2017 |
|---|---|
| Instrument Type | Exchange Traded Fund |
| Share Class | Do-It-Yourself |
| Legal Status | Trust |
| Sales Status | - |
| Currency | CAD |
| Distribution Frequency | Monthly |
| Assets ($mil) | - |
| 52 Week High | $50.27 |
| 52 Week Low | $33.71 |
| Annual Dividend | $0.12 |
| Annual Yield | - |
| Index | Solactive Global Cyber Security Index |
| Shares Outstanding | - |
| Registered Plan Eligible | Yes |
| Exposure | 1x performance |
|---|---|
| Asset Class High | - |
| Asset Class Medium | - |
| Asset Class Low | - |
| Leveraged | - |
| Inverse | - |
| Advisor Series | - |
| Covered Call Strategy | No |
The Fund seeks to replicate, to the extent reasonably possible and before fees and expenses, the performance of the Solactive Global Cyber Security Index Hedged, or any successor thereto. The Fund invests primarily in equity securities of companies located domestically or internationally that are involved in the cyber security industry through hardware and software development.
In order to achieve its investment objective, the Fund seeks to hold the constituent securities of the applicable Index in approximately the same proportion as they are reflected in the Index. Alternatively, employ a sampling strategy whereby the fund holds a portfolio of securities that closely matches the aggregate investment of the securities included in the Index.
| Name | Start Date |
|---|---|
| Evolve Funds Group Inc. | 09-18-2017 |
| Fund Manager | Evolve Funds Group Inc. |
|---|---|
| Advisor | Evolve Funds Group Inc. |
| Custodian | CIBC Mellon Trust Company |
| Registrar | TSX Trust Company |
| Distributor | - |
| Auditor | Ernst & Young LLP |
| MER | 0.62% |
|---|---|
| Management Fee | 0.40% |
Join Fund Library now and get free access to personalized features to help you manage your investments.
 Fund Library