Join Fund Library now and get free access to personalized features to help you manage your investments.
Cdn Small/Mid Cap Equity
 Click for more information on Fundata’s FundGrade
Click for more information on Fundata’s FundGrade.
 Click for more information on Fundata’s ESG Grade
Click for more information on Fundata’s ESG Grade.
|
NAVPS (05-17-2024) |
$13.70 |
|---|---|
| Change |
$0.02
(0.18%)
|
As at April 30, 2024
As at April 30, 2024
As at February 29, 2024
Inception Return (February 21, 1996): 3.60%
| Row Heading | Return | Annualized Return | ||||||||||||
|---|---|---|---|---|---|---|---|---|---|---|---|---|---|---|
| 1 Mth | 3 Mth | 6 Mth | YTD | 1 Yr | 2 Yr | 3 Yr | 4 Yr | 5 Yr | 6 Yr | 7 Yr | 8 Yr | 9 Yr | 10 Yr | |
| Fund | -2.16% | 0.23% | 12.06% | 1.72% | 2.93% | 0.28% | 1.45% | 11.65% | 7.70% | 5.39% | 4.43% | 5.60% | 4.98% | 3.92% |
| Benchmark | 0.17% | 8.50% | 17.60% | 8.10% | 9.69% | 0.65% | 2.64% | 15.86% | 7.92% | 5.32% | 4.57% | 5.57% | 5.07% | 3.57% |
| Category Average | -1.98% | 16.13% | 16.13% | 4.41% | 8.17% | 3.47% | 2.22% | 12.84% | 6.98% | 5.40% | 4.74% | 5.51% | 4.28% | 3.85% |
| Category Rank | 84 / 212 | 200 / 209 | 200 / 209 | 203 / 209 | 189 / 208 | 170 / 206 | 112 / 197 | 105 / 188 | 102 / 182 | 100 / 172 | 105 / 163 | 98 / 160 | 85 / 136 | 93 / 131 |
| Quartile Ranking | 2 | 4 | 4 | 4 | 4 | 4 | 3 | 3 | 3 | 3 | 3 | 3 | 3 | 3 |
| Return % | May | Jun | Jul | Aug | Sep | Oct | Nov | Dec | Jan | Feb | Mar | Apr |
|---|---|---|---|---|---|---|---|---|---|---|---|---|
| Fund | -2.90% | 2.52% | 1.63% | -1.51% | -4.26% | -3.71% | 6.54% | 3.40% | 1.49% | 0.78% | 1.65% | -2.16% |
| Benchmark | -4.06% | 0.59% | 6.09% | -1.31% | -5.24% | -2.58% | 4.84% | 3.76% | -0.37% | 0.77% | 7.49% | 0.17% |
33.15% (February 2000)
-24.32% (March 2020)
| Return % | 2014 | 2015 | 2016 | 2017 | 2018 | 2019 | 2020 | 2021 | 2022 | 2023 |
|---|---|---|---|---|---|---|---|---|---|---|
| Fund | -1.87% | 1.57% | 14.03% | 6.04% | -19.00% | 22.51% | 16.09% | 19.99% | -10.09% | 4.69% |
| Benchmark | -2.34% | -13.31% | 38.48% | 2.75% | -18.17% | 15.84% | 12.87% | 20.27% | -9.29% | 4.79% |
| Category Average | 3.45% | -6.13% | 18.01% | 3.43% | -15.15% | 16.59% | 11.91% | 22.35% | -11.32% | 6.49% |
| Quartile Ranking | 4 | 1 | 3 | 2 | 4 | 2 | 2 | 3 | 2 | 3 |
| Category Rank | 116/ 130 | 24/ 135 | 115/ 157 | 49/ 162 | 146/ 172 | 66/ 179 | 85/ 184 | 145/ 196 | 81/ 205 | 135/ 208 |
22.51% (2019)
-19.00% (2018)
| Name | Percent |
|---|---|
| Canadian Equity | 91.06 |
| Income Trust Units | 7.34 |
| International Equity | 1.45 |
| Cash and Equivalents | 0.15 |
| Name | Percent |
|---|---|
| Real Estate | 24.67 |
| Energy | 14.43 |
| Financial Services | 14.38 |
| Consumer Goods | 9.28 |
| Basic Materials | 9.09 |
| Other | 28.15 |
| Name | Percent |
|---|---|
| North America | 98.55 |
| Asia | 0.79 |
| Europe | 0.66 |
| Name | Percent |
|---|---|
| SNC-Lavalin Group Inc | 5.17 |
| Tricon Residential Inc | 3.77 |
| Morguard Corp | 3.62 |
| Aritzia Inc | 3.41 |
| Element Fleet Management Corp | 3.31 |
| Cargojet Inc | 3.03 |
| AltaGas Ltd | 2.89 |
| ATS Corp | 2.79 |
| Whitecap Resources Inc | 2.48 |
| goeasy Ltd | 2.47 |
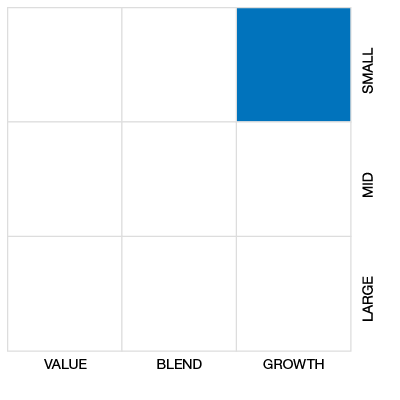

AGF Canadian Small Cap Fund Mutual Fund Series
Median
Other - Cdn Small/Mid Cap Equity
| Standard Deviation | 13.61% | 18.77% | 15.29% |
|---|---|---|---|
| Beta | 0.70% | 0.70% | 0.66% |
| Alpha | 0.00% | 0.02% | 0.01% |
| Rsquared | 0.71% | 0.85% | 0.76% |
| Sharpe | -0.03% | 0.39% | 0.24% |
| Sortino | -0.07% | 0.46% | 0.18% |
| Treynor | -0.01% | 0.10% | 0.06% |
| Tax Efficiency | 100.00% | 100.00% | 100.00% |
| Volatility |

|

|
|

| Key Ratio | 1 Yr | 3 Yr | 5 Yr | 10 Yr |
|---|---|---|---|---|
| Standard Deviation | 11.21% | 13.61% | 18.77% | 15.29% |
| Beta | 0.63% | 0.70% | 0.70% | 0.66% |
| Alpha | -0.03% | 0.00% | 0.02% | 0.01% |
| Rsquared | 0.61% | 0.71% | 0.85% | 0.76% |
| Sharpe | -0.12% | -0.03% | 0.39% | 0.24% |
| Sortino | 0.06% | -0.07% | 0.46% | 0.18% |
| Treynor | -0.02% | -0.01% | 0.10% | 0.06% |
| Tax Efficiency | 100.00% | 100.00% | 100.00% | 100.00% |
The E, S, and G scores are averaged for each security in the portfolio, to arrive at an ESG score for each security. We take the portfolio weighted average of the ESG scores for each fund and rank them against their peers to arrive at the Fundata ESG Score from 0-100.
Three scores under the Environment bucket are averaged to yield the Fundata Environment Score for each fund from 0-100: (1) Pollution Prevention, (2) Environmental Transparency, (3) Resource Efficiency.
Six scores under the Social bucket are averaged to yield the Fundata Social Score for each fund from 0-100. (1) Compensation and Satisfaction, (2) Diversity and Rights, (3) Education and Work Conditions, (4) Community and Charity, (5) Human Rights, (6) Sustainability Integration.
Three scores under the governance bucket are averaged to yield the Fundata Governance Score for each fund from 0-100: (1) Board Effectiveness, (2) Management Ethics, (3) Disclosure and Accountability.
Powered by OWL Analytics. For more information, please contact Fundata Canada.
| Start Date | February 21, 1996 |
|---|---|
| Instrument Type | Mutual Fund |
| Share Class | Commission Based Advice |
| Legal Status | Trust |
| Sales Status | Open |
| Currency | CAD |
| Distribution Frequency | Annual |
| Assets ($mil) | $224 |
| FundServ Code | Load Code | Sales Status |
|---|---|---|
| AGF259 | ||
| AGF696 | ||
| AGF796 |
The Fund’s objective is to provide superior capital growth. It invests primarily in shares and other securities of small and medium Canadian companies that have the potential to generate above-average growth.
The portfolio manager uses a fundamental bottom-up investment process to identify attractive businesses trading at reasonable valuations. This core investment process is complemented by top-down macroeconomic and industry outlooks. The portfolio manager may develop strong views concerning certain macro or industry factors, in which case sector weights are adjusted to compensate for the expected opportunities/risks.
| Name | Start Date |
|---|---|
| Michael Fricker | 02-19-2013 |
| Jeff Bay | 09-30-2022 |
| Fund Manager | AGF Investments Inc. |
|---|---|
| Advisor | Cypress Capital Management Ltd. |
| Custodian | CIBC Mellon Trust Company |
| Registrar | AGF CustomerFirst Inc. |
| Distributor | - |
| Auditor | PriceWaterhouseCoopers LLP |
| RSP Eligible | Yes |
|---|---|
| PAC Allowed | Yes |
| PAC Initial Investment | 25 |
| PAC Subsequent | 25 |
| SWP Allowed | Yes |
| SWP Min Balance | 0 |
| SWP Min Withdrawal | 0 |
| MER | 2.82% |
|---|---|
| Management Fee | 2.25% |
| Load | Choice of Front or No Load |
| FE Max | 6.00% |
| DSC Max | 5.50% |
| Trailer Fee Max (FE) | 1.00% |
| Trailer Fee Max (DSC) | 1.00% |
| Trailer Fee Max (NL) | - |
| Trailer Fee Max (LL) | - |
Join Fund Library now and get free access to personalized features to help you manage your investments.
 Fund Library