Join Fund Library now and get free access to personalized features to help you manage your investments.
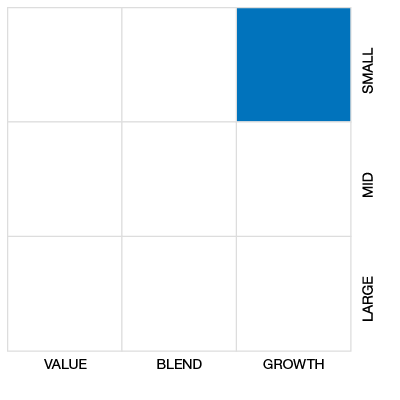
Cdn Small/Mid Cap Equity
 Click for more information on Fundata’s FundGrade
Click for more information on Fundata’s FundGrade.
|
NAVPS (05-17-2024) |
$52.58 |
|---|---|
| Change |
$0.21
(0.40%)
|
As at April 30, 2024
As at January 31, 2024
Inception Return (August 03, 1993): 7.49%
| Row Heading | Return | Annualized Return | ||||||||||||
|---|---|---|---|---|---|---|---|---|---|---|---|---|---|---|
| 1 Mth | 3 Mth | 6 Mth | YTD | 1 Yr | 2 Yr | 3 Yr | 4 Yr | 5 Yr | 6 Yr | 7 Yr | 8 Yr | 9 Yr | 10 Yr | |
| Fund | -0.94% | 2.29% | 18.93% | 4.28% | 0.59% | -2.70% | -3.78% | 7.96% | 5.54% | 4.11% | 3.64% | 4.72% | 2.94% | 3.55% |
| Benchmark | 0.17% | 8.50% | 17.60% | 8.10% | 9.69% | 0.65% | 2.64% | 15.86% | 7.92% | 5.32% | 4.57% | 5.57% | 5.07% | 3.57% |
| Category Average | -1.98% | 16.13% | 16.13% | 4.41% | 8.17% | 3.47% | 2.22% | 12.84% | 6.98% | 5.40% | 4.74% | 5.51% | 4.28% | 3.85% |
| Category Rank | 37 / 212 | 117 / 209 | 69 / 209 | 116 / 209 | 198 / 208 | 201 / 206 | 165 / 197 | 178 / 188 | 130 / 182 | 122 / 172 | 114 / 163 | 110 / 160 | 111 / 136 | 106 / 131 |
| Quartile Ranking | 1 | 3 | 2 | 3 | 4 | 4 | 4 | 4 | 3 | 3 | 3 | 3 | 4 | 4 |
| Return % | May | Jun | Jul | Aug | Sep | Oct | Nov | Dec | Jan | Feb | Mar | Apr |
|---|---|---|---|---|---|---|---|---|---|---|---|---|
| Fund | -3.72% | 0.17% | 0.60% | -2.97% | -6.81% | -3.60% | 8.55% | 5.07% | 1.94% | 2.81% | 0.44% | -0.94% |
| Benchmark | -4.06% | 0.59% | 6.09% | -1.31% | -5.24% | -2.58% | 4.84% | 3.76% | -0.37% | 0.77% | 7.49% | 0.17% |
22.22% (February 2000)
-22.94% (March 2020)
| Return % | 2014 | 2015 | 2016 | 2017 | 2018 | 2019 | 2020 | 2021 | 2022 | 2023 |
|---|---|---|---|---|---|---|---|---|---|---|
| Fund | 12.32% | -5.27% | 9.48% | 5.18% | -17.05% | 26.18% | 23.09% | 22.61% | -20.90% | -3.98% |
| Benchmark | -2.34% | -13.31% | 38.48% | 2.75% | -18.17% | 15.84% | 12.87% | 20.27% | -9.29% | 4.79% |
| Category Average | 3.45% | -6.13% | 18.01% | 3.43% | -15.15% | 16.59% | 11.91% | 22.35% | -11.32% | 6.49% |
| Quartile Ranking | 1 | 3 | 4 | 2 | 3 | 1 | 1 | 3 | 4 | 4 |
| Category Rank | 27/ 130 | 85/ 135 | 133/ 157 | 59/ 162 | 118/ 172 | 36/ 179 | 22/ 184 | 102/ 196 | 187/ 205 | 204/ 208 |
26.18% (2019)
-20.90% (2022)
| Name | Percent |
|---|---|
| Canadian Equity | 88.95 |
| Cash and Equivalents | 5.27 |
| Income Trust Units | 3.94 |
| International Equity | 1.53 |
| US Equity | 0.31 |
| Name | Percent |
|---|---|
| Financial Services | 17.58 |
| Basic Materials | 15.75 |
| Energy | 11.69 |
| Technology | 10.77 |
| Real Estate | 10.36 |
| Other | 33.85 |
| Name | Percent |
|---|---|
| North America | 96.76 |
| Latin America | 1.71 |
| Asia | 1.53 |
| Name | Percent |
|---|---|
| Trisura Group Ltd | 6.06 |
| North American Construction Group Ltd | 5.74 |
| Andlauer Healthcare Group Inc | 5.18 |
| Storagevault Canada Inc | 4.53 |
| Pet Valu Holdings Ltd | 4.32 |
| Cargojet Inc | 3.93 |
| Polaris Renewable Energy Inc | 3.84 |
| K92 Mining Inc | 3.36 |
| EQB Inc | 3.08 |
| Docebo Inc | 2.95 |

BMO Canadian Small Cap Equity Fund Series A
Median
Other - Cdn Small/Mid Cap Equity
| Standard Deviation | 15.23% | 19.69% | 16.04% |
|---|---|---|---|
| Beta | 0.65% | 0.68% | 0.64% |
| Alpha | -0.05% | 0.00% | 0.01% |
| Rsquared | 0.50% | 0.74% | 0.65% |
| Sharpe | -0.36% | 0.27% | 0.21% |
| Sortino | -0.49% | 0.31% | 0.16% |
| Treynor | -0.08% | 0.08% | 0.05% |
| Tax Efficiency | - | 88.25% | 74.70% |
| Volatility |

|

|

|

| Key Ratio | 1 Yr | 3 Yr | 5 Yr | 10 Yr |
|---|---|---|---|---|
| Standard Deviation | 14.54% | 15.23% | 19.69% | 16.04% |
| Beta | 0.75% | 0.65% | 0.68% | 0.64% |
| Alpha | -0.06% | -0.05% | 0.00% | 0.01% |
| Rsquared | 0.51% | 0.50% | 0.74% | 0.65% |
| Sharpe | -0.22% | -0.36% | 0.27% | 0.21% |
| Sortino | -0.15% | -0.49% | 0.31% | 0.16% |
| Treynor | -0.04% | -0.08% | 0.08% | 0.05% |
| Tax Efficiency | - | - | 88.25% | 74.70% |
| Start Date | August 03, 1993 |
|---|---|
| Instrument Type | Mutual Fund |
| Share Class | Commission Based Advice |
| Legal Status | Trust |
| Sales Status | Open |
| Currency | CAD |
| Distribution Frequency | Annual |
| Assets ($mil) | $189 |
| FundServ Code | Load Code | Sales Status |
|---|---|---|
| BMO136 | ||
| BMO70136 |
This fund’s objective is to provide above-average growth in the value of your investment over the long term by investing in small and mid-sized Canadian companies. The fundamental investment objectives may only be changed with the approval of a majority of the votes cast at a meeting of unitholders called for that purpose.
These are the strategies the portfolio manager uses to try to achieve the fund’s objective: invests in equities of Canadian small and mid-sized companies; examines the financial statistics of each company it’s considering to determine if the equity securities are attractively priced; may emphasize specific industry sectors with high potential return or companies that may benefit from trends like an aging population.
| Name | Start Date |
|---|---|
| Valentin Padure | 04-23-2024 |
| Jordan Luckock | 04-23-2024 |
| Fund Manager | BMO Investments Inc. |
|---|---|
| Advisor | BMO Asset Management Inc. |
| Custodian | State Street Trust Company Canada |
| Registrar | State Street Trust Company Canada |
| Distributor | BMO Investments Inc. |
| Auditor | PriceWaterhouseCoopers LLP |
| RSP Eligible | Yes |
|---|---|
| PAC Allowed | Yes |
| PAC Initial Investment | 50 |
| PAC Subsequent | 50 |
| SWP Allowed | Yes |
| SWP Min Balance | 10,000 |
| SWP Min Withdrawal | 100 |
| MER | 2.50% |
|---|---|
| Management Fee | 2.00% |
| Load | No Load |
| FE Max | - |
| DSC Max | - |
| Trailer Fee Max (FE) | - |
| Trailer Fee Max (DSC) | - |
| Trailer Fee Max (NL) | 1.00% |
| Trailer Fee Max (LL) | - |
Join Fund Library now and get free access to personalized features to help you manage your investments.
 Fund Library