Join Fund Library now and get free access to personalized features to help you manage your investments.
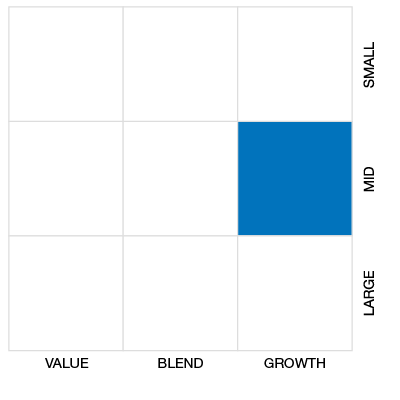
Global Small/Mid Cap Eq
 Click for more information on Fundata’s FundGrade
Click for more information on Fundata’s FundGrade.
 Click for more information on Fundata’s ESG Grade
Click for more information on Fundata’s ESG Grade.
|
NAVPS (05-17-2024) |
$21.28 |
|---|---|
| Change |
-$0.06
(-0.29%)
|
As at April 30, 2024
As at February 29, 2024
As at February 29, 2024
Inception Return (June 06, 2005): 6.09%
| Row Heading | Return | Annualized Return | ||||||||||||
|---|---|---|---|---|---|---|---|---|---|---|---|---|---|---|
| 1 Mth | 3 Mth | 6 Mth | YTD | 1 Yr | 2 Yr | 3 Yr | 4 Yr | 5 Yr | 6 Yr | 7 Yr | 8 Yr | 9 Yr | 10 Yr | |
| Fund | -5.13% | 0.30% | 17.62% | -3.12% | 11.21% | 4.28% | -2.54% | 9.71% | 5.89% | 4.75% | 5.18% | 6.37% | 5.48% | 5.79% |
| Benchmark | -3.18% | 5.85% | 17.91% | 4.23% | 13.66% | 9.09% | 3.29% | 11.85% | 6.73% | 6.36% | 6.47% | 8.73% | 7.45% | 8.39% |
| Category Average | -3.01% | 16.09% | 16.09% | 2.97% | 9.68% | 6.68% | 0.43% | 9.80% | 5.15% | 4.16% | 4.31% | 5.97% | 4.65% | 5.33% |
| Category Rank | 250 / 273 | 241 / 270 | 87 / 270 | 254 / 270 | 110 / 263 | 182 / 242 | 167 / 222 | 114 / 203 | 105 / 181 | 89 / 153 | 88 / 142 | 92 / 137 | 68 / 112 | 69 / 90 |
| Quartile Ranking | 4 | 4 | 2 | 4 | 2 | 4 | 4 | 3 | 3 | 3 | 3 | 3 | 3 | 4 |
| Return % | May | Jun | Jul | Aug | Sep | Oct | Nov | Dec | Jan | Feb | Mar | Apr |
|---|---|---|---|---|---|---|---|---|---|---|---|---|
| Fund | -0.17% | 5.14% | 1.66% | -0.85% | -4.68% | -6.24% | 12.12% | 8.28% | -3.41% | 5.99% | -0.25% | -5.13% |
| Benchmark | -2.87% | 4.01% | 4.07% | -0.53% | -4.79% | -3.18% | 7.14% | 5.59% | -1.54% | 5.26% | 3.87% | -3.18% |
13.93% (April 2020)
-15.67% (March 2020)
| Return % | 2014 | 2015 | 2016 | 2017 | 2018 | 2019 | 2020 | 2021 | 2022 | 2023 |
|---|---|---|---|---|---|---|---|---|---|---|
| Fund | 5.76% | 13.22% | -1.61% | 15.24% | -12.18% | 18.92% | 31.96% | 19.24% | -29.92% | 21.01% |
| Benchmark | 9.59% | 16.61% | 7.47% | 15.40% | -7.34% | 20.09% | 11.07% | 15.50% | -13.14% | 14.59% |
| Category Average | 6.30% | 9.56% | 3.48% | 12.62% | -10.42% | 13.76% | 14.53% | 12.37% | -15.59% | 12.82% |
| Quartile Ranking | 3 | 3 | 4 | 2 | 4 | 2 | 1 | 1 | 4 | 1 |
| Category Rank | 64/ 89 | 60/ 107 | 114/ 137 | 53/ 142 | 127/ 152 | 67/ 178 | 29/ 184 | 29/ 219 | 203/ 241 | 42/ 257 |
31.96% (2020)
-29.92% (2022)
| Name | Percent |
|---|---|
| US Equity | 51.29 |
| International Equity | 37.48 |
| Canadian Equity | 8.51 |
| Cash and Equivalents | 1.80 |
| Income Trust Units | 0.88 |
| Other | 0.04 |
| Name | Percent |
|---|---|
| Technology | 28.77 |
| Healthcare | 12.28 |
| Consumer Services | 10.99 |
| Industrial Services | 10.52 |
| Industrial Goods | 10.46 |
| Other | 26.98 |
| Name | Percent |
|---|---|
| North America | 62.19 |
| Asia | 27.01 |
| Europe | 7.51 |
| Africa and Middle East | 3.25 |
| Other | 0.04 |
| Name | Percent |
|---|---|
| Persistent Systems Ltd | 3.34 |
| HealthEquity Inc | 3.21 |
| Globant SA | 3.00 |
| RBC Bearings Inc | 2.62 |
| Voltronic Power Technology Corp | 2.53 |
| Ensign Group Inc | 2.53 |
| Trex Co Inc | 2.37 |
| AU Small Finance Bank Ltd | 2.35 |
| Five Below Inc | 2.32 |
| Freshpet Inc | 2.22 |

Counsel Global Small Cap Series A
Median
Other - Global Small/Mid Cap Eq
| Standard Deviation | 19.39% | 19.84% | 15.64% |
|---|---|---|---|
| Beta | 1.19% | 1.10% | 1.02% |
| Alpha | -0.06% | -0.01% | -0.02% |
| Rsquared | 0.84% | 0.85% | 0.84% |
| Sharpe | -0.18% | 0.29% | 0.35% |
| Sortino | -0.27% | 0.35% | 0.36% |
| Treynor | -0.03% | 0.05% | 0.05% |
| Tax Efficiency | - | 100.00% | 96.29% |
| Volatility |

|
|

|

| Key Ratio | 1 Yr | 3 Yr | 5 Yr | 10 Yr |
|---|---|---|---|---|
| Standard Deviation | 20.02% | 19.39% | 19.84% | 15.64% |
| Beta | 1.23% | 1.19% | 1.10% | 1.02% |
| Alpha | -0.05% | -0.06% | -0.01% | -0.02% |
| Rsquared | 0.81% | 0.84% | 0.85% | 0.84% |
| Sharpe | 0.38% | -0.18% | 0.29% | 0.35% |
| Sortino | 0.90% | -0.27% | 0.35% | 0.36% |
| Treynor | 0.06% | -0.03% | 0.05% | 0.05% |
| Tax Efficiency | 100.00% | - | 100.00% | 96.29% |
The E, S, and G scores are averaged for each security in the portfolio, to arrive at an ESG score for each security. We take the portfolio weighted average of the ESG scores for each fund and rank them against their peers to arrive at the Fundata ESG Score from 0-100.
Three scores under the Environment bucket are averaged to yield the Fundata Environment Score for each fund from 0-100: (1) Pollution Prevention, (2) Environmental Transparency, (3) Resource Efficiency.
Six scores under the Social bucket are averaged to yield the Fundata Social Score for each fund from 0-100. (1) Compensation and Satisfaction, (2) Diversity and Rights, (3) Education and Work Conditions, (4) Community and Charity, (5) Human Rights, (6) Sustainability Integration.
Three scores under the governance bucket are averaged to yield the Fundata Governance Score for each fund from 0-100: (1) Board Effectiveness, (2) Management Ethics, (3) Disclosure and Accountability.
Powered by OWL Analytics. For more information, please contact Fundata Canada.
| Start Date | June 06, 2005 |
|---|---|
| Instrument Type | Mutual Fund |
| Share Class | Commission Based Advice |
| Legal Status | Trust |
| Sales Status | Open |
| Currency | CAD |
| Distribution Frequency | Monthly |
| Assets ($mil) | $205 |
| FundServ Code | Load Code | Sales Status |
|---|---|---|
| CGF470 | ||
| CGF472 | ||
| CGF473 |
The investment objective of Counsel Global Small Cap is to seek long-term growth of capital by investing primarily in global small cap equity securities. Counsel Global Small Cap may also invest in mutual fund securities, equities and fixed-income securities of issuers located anywhere in the world, depending upon prevailing market conditions.
The sub-advisors invest primarily in Canadian, U.S. and international small cap equities as measured at the time of investment. Small capitalization equities may grow to become mid- to large-capitalization equities at the time they are sold. The term “small capitalization securities” has different meanings depending on the market and the size of the company within the market.
| Name | Start Date |
|---|---|
| Counsel Portfolio Services Inc. | 10-28-2009 |
| Wasatch Global Investors | 07-22-2019 |
| Mackenzie Financial Corporation | 07-22-2019 |
| Fund Manager | Counsel Portfolio Services Inc. |
|---|---|
| Advisor | Counsel Portfolio Services Inc. |
| Custodian | Canadian Imperial Bank of Commerce |
| Registrar | Mackenzie Financial Corporation |
| Distributor | - |
| Auditor | Deloitte LLP |
| RSP Eligible | Yes |
|---|---|
| PAC Allowed | Yes |
| PAC Initial Investment | 50 |
| PAC Subsequent | 50 |
| SWP Allowed | Yes |
| SWP Min Balance | 10,000 |
| SWP Min Withdrawal | 100 |
| MER | 2.44% |
|---|---|
| Management Fee | 2.00% |
| Load | Choice of Front or No Load |
| FE Max | 5.00% |
| DSC Max | 4.00% |
| Trailer Fee Max (FE) | 1.00% |
| Trailer Fee Max (DSC) | 1.00% |
| Trailer Fee Max (NL) | - |
| Trailer Fee Max (LL) | - |
Join Fund Library now and get free access to personalized features to help you manage your investments.
 Fund Library