Join Fund Library now and get free access to personalized features to help you manage your investments.
Emerging Markets Equity
 Click for more information on Fundata’s FundGrade
Click for more information on Fundata’s FundGrade.
 Click for more information on Fundata’s ESG Grade
Click for more information on Fundata’s ESG Grade.

2023
Click for more information on Fundata’s FundGrade
|
NAVPS (05-17-2024) |
$17.04 |
|---|---|
| Change |
-$0.02
(-0.13%)
|
As at April 30, 2024
As at February 29, 2024
As at February 29, 2024
Inception Return (August 09, 2002): 6.62%
| Row Heading | Return | Annualized Return | ||||||||||||
|---|---|---|---|---|---|---|---|---|---|---|---|---|---|---|
| 1 Mth | 3 Mth | 6 Mth | YTD | 1 Yr | 2 Yr | 3 Yr | 4 Yr | 5 Yr | 6 Yr | 7 Yr | 8 Yr | 9 Yr | 10 Yr | |
| Fund | 2.44% | 10.18% | 15.40% | 8.70% | 15.53% | 7.93% | -0.75% | 9.48% | 5.48% | 3.09% | 4.16% | 6.90% | 5.06% | 5.50% |
| Benchmark | 3.23% | 10.40% | 13.97% | 7.96% | 12.80% | 6.58% | -0.16% | 6.60% | 3.28% | 2.95% | 4.27% | 7.20% | 4.72% | 6.13% |
| Category Average | 1.20% | 13.74% | 13.74% | 5.95% | 10.36% | 5.03% | -3.77% | 5.69% | 2.22% | 1.43% | 2.91% | 5.48% | 3.19% | 3.77% |
| Category Rank | 56 / 330 | 111 / 327 | 102 / 327 | 66 / 327 | 74 / 312 | 76 / 302 | 85 / 278 | 51 / 266 | 52 / 250 | 66 / 203 | 67 / 193 | 62 / 159 | 45 / 145 | 51 / 134 |
| Quartile Ranking | 1 | 2 | 2 | 1 | 1 | 2 | 2 | 1 | 1 | 2 | 2 | 2 | 2 | 2 |
| Return % | May | Jun | Jul | Aug | Sep | Oct | Nov | Dec | Jan | Feb | Mar | Apr |
|---|---|---|---|---|---|---|---|---|---|---|---|---|
| Fund | -1.05% | 2.00% | 5.28% | -3.16% | -0.64% | -2.09% | 4.58% | 1.51% | -1.34% | 6.38% | 1.11% | 2.44% |
| Benchmark | -2.01% | 1.39% | 5.60% | -2.72% | -1.99% | -1.05% | 4.87% | 0.67% | -2.21% | 5.63% | 1.24% | 3.23% |
13.44% (November 2022)
-16.12% (October 2008)
| Return % | 2014 | 2015 | 2016 | 2017 | 2018 | 2019 | 2020 | 2021 | 2022 | 2023 |
|---|---|---|---|---|---|---|---|---|---|---|
| Fund | 5.97% | -0.42% | 9.05% | 27.67% | -15.23% | 10.12% | 18.87% | 3.47% | -15.03% | 14.07% |
| Benchmark | 8.76% | 2.69% | 7.90% | 26.42% | -6.05% | 15.55% | 11.45% | 0.08% | -12.38% | 7.03% |
| Category Average | 2.91% | -3.92% | 6.53% | 28.88% | -11.86% | 15.06% | 17.52% | -3.30% | -17.32% | 8.68% |
| Quartile Ranking | 3 | 4 | 1 | 3 | 4 | 4 | 2 | 1 | 2 | 1 |
| Category Rank | 66/ 131 | 110/ 144 | 37/ 155 | 114/ 186 | 184/ 202 | 212/ 246 | 127/ 261 | 38/ 269 | 107/ 289 | 53/ 310 |
27.67% (2017)
-15.23% (2018)
| Name | Percent |
|---|---|
| International Equity | 94.10 |
| Cash and Equivalents | 2.81 |
| Income Trust Units | 1.96 |
| US Equity | 0.90 |
| Foreign Corporate Bonds | 0.22 |
| Other | 0.01 |
| Name | Percent |
|---|---|
| Technology | 28.84 |
| Financial Services | 22.29 |
| Consumer Goods | 13.23 |
| Energy | 5.83 |
| Consumer Services | 5.61 |
| Other | 24.20 |
| Name | Percent |
|---|---|
| Asia | 70.63 |
| Latin America | 10.53 |
| Africa and Middle East | 7.77 |
| North America | 3.71 |
| Europe | 3.68 |
| Other | 3.68 |
| Name | Percent |
|---|---|
| Taiwan Semiconductor Manufactrg Co Ltd | 7.18 |
| Tencent Holdings Ltd | 3.82 |
| Cash and Cash Equivalents | 2.81 |
| Samsung Electronics Co Ltd | 2.78 |
| Petroleo Brasileiro SA Petrobras - Pfd | 2.44 |
| MediaTek Inc | 2.42 |
| Kia Corp | 2.06 |
| Tata Motors Ltd | 1.92 |
| Larsen & Toubro Ltd | 1.88 |
| Trent Ltd | 1.81 |
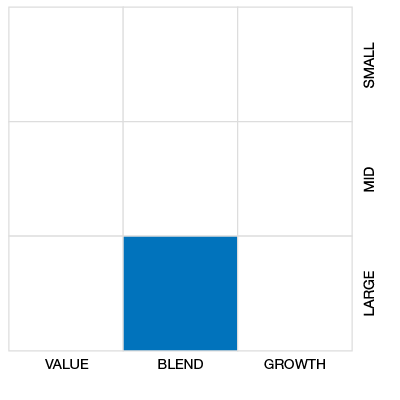

Mackenzie Emerging Markets Fund II Series A
Median
Other - Emerging Markets Equity
| Standard Deviation | 13.95% | 15.21% | 13.82% |
|---|---|---|---|
| Beta | 1.00% | 1.01% | 0.96% |
| Alpha | -0.01% | 0.02% | 0.00% |
| Rsquared | 0.90% | 0.88% | 0.84% |
| Sharpe | -0.18% | 0.30% | 0.35% |
| Sortino | -0.31% | 0.35% | 0.37% |
| Treynor | -0.03% | 0.04% | 0.05% |
| Tax Efficiency | - | 44.94% | 68.52% |
| Volatility |

|
|

|

| Key Ratio | 1 Yr | 3 Yr | 5 Yr | 10 Yr |
|---|---|---|---|---|
| Standard Deviation | 10.54% | 13.95% | 15.21% | 13.82% |
| Beta | 0.94% | 1.00% | 1.01% | 0.96% |
| Alpha | 0.03% | -0.01% | 0.02% | 0.00% |
| Rsquared | 0.94% | 0.90% | 0.88% | 0.84% |
| Sharpe | 0.97% | -0.18% | 0.30% | 0.35% |
| Sortino | 2.56% | -0.31% | 0.35% | 0.37% |
| Treynor | 0.11% | -0.03% | 0.04% | 0.05% |
| Tax Efficiency | 100.00% | - | 44.94% | 68.52% |
The E, S, and G scores are averaged for each security in the portfolio, to arrive at an ESG score for each security. We take the portfolio weighted average of the ESG scores for each fund and rank them against their peers to arrive at the Fundata ESG Score from 0-100.
Three scores under the Environment bucket are averaged to yield the Fundata Environment Score for each fund from 0-100: (1) Pollution Prevention, (2) Environmental Transparency, (3) Resource Efficiency.
Six scores under the Social bucket are averaged to yield the Fundata Social Score for each fund from 0-100. (1) Compensation and Satisfaction, (2) Diversity and Rights, (3) Education and Work Conditions, (4) Community and Charity, (5) Human Rights, (6) Sustainability Integration.
Three scores under the governance bucket are averaged to yield the Fundata Governance Score for each fund from 0-100: (1) Board Effectiveness, (2) Management Ethics, (3) Disclosure and Accountability.
Powered by OWL Analytics. For more information, please contact Fundata Canada.
| Start Date | August 09, 2002 |
|---|---|
| Instrument Type | Mutual Fund |
| Share Class | Commission Based Advice |
| Legal Status | Trust |
| Sales Status | Capped |
| Currency | CAD |
| Distribution Frequency | Annual |
| Assets ($mil) | $59 |
| FundServ Code | Load Code | Sales Status |
|---|---|---|
| MFC8848 | ||
| MFC8849 | ||
| MFC8853 | ||
| MFC8855 |
Investors who: are looking for an emerging markets global equity fund to hold as part of their portfolio; want a long-term investment; can handle the volatility of stock markets, including emerging and frontier markets
The Fund seeks long-term capital growth by investing primarily in equities of companies in emerging markets. The Fund will focus its investments in those countries where the portfolio manager identifies strongly developing economies and in which the markets are becoming more sophisticated.
| Name | Start Date |
|---|---|
| Arup Datta | 08-01-2021 |
| Nicholas Tham | 08-01-2021 |
| Fund Manager | Mackenzie Investments |
|---|---|
| Advisor | Mackenzie Investments |
| Custodian | - |
| Registrar | - |
| Distributor | - |
| Auditor | - |
| RSP Eligible | Yes |
|---|---|
| PAC Allowed | No |
| PAC Initial Investment | - |
| PAC Subsequent | - |
| SWP Allowed | No |
| SWP Min Balance | - |
| SWP Min Withdrawal | - |
| MER | 2.51% |
|---|---|
| Management Fee | 2.00% |
| Load | Choice of Front or No Load |
| FE Max | 5.00% |
| DSC Max | 5.00% |
| Trailer Fee Max (FE) | - |
| Trailer Fee Max (DSC) | - |
| Trailer Fee Max (NL) | - |
| Trailer Fee Max (LL) | - |
Join Fund Library now and get free access to personalized features to help you manage your investments.
 Fund Library