Join Fund Library now and get free access to personalized features to help you manage your investments.
Canadian Equity
 Click for more information on Fundata’s FundGrade
Click for more information on Fundata’s FundGrade.
 Click for more information on Fundata’s ESG Grade
Click for more information on Fundata’s ESG Grade.
|
NAVPS (05-17-2024) |
$15.04 |
|---|---|
| Change |
$0.06
(0.43%)
|
As at April 30, 2024
As at February 29, 2024
As at February 29, 2024
Inception Return (June 27, 2016): 7.15%
| Row Heading | Return | Annualized Return | ||||||||||||
|---|---|---|---|---|---|---|---|---|---|---|---|---|---|---|
| 1 Mth | 3 Mth | 6 Mth | YTD | 1 Yr | 2 Yr | 3 Yr | 4 Yr | 5 Yr | 6 Yr | 7 Yr | 8 Yr | 9 Yr | 10 Yr | |
| Fund | -1.38% | 3.38% | 17.32% | 5.48% | 10.20% | 7.55% | 5.96% | 10.88% | 7.45% | 7.24% | 6.28% | - | - | - |
| Benchmark | -1.82% | 4.10% | 16.91% | 4.68% | 8.73% | 5.66% | 7.59% | 13.51% | 8.86% | 8.98% | 8.12% | 8.95% | 7.25% | 7.22% |
| Category Average | -2.02% | 14.76% | 14.76% | 4.01% | 7.13% | 4.79% | 6.78% | 12.37% | 7.64% | 7.44% | 6.57% | 7.36% | 5.95% | 5.96% |
| Category Rank | 89 / 725 | 373 / 722 | 136 / 721 | 110 / 722 | 131 / 703 | 107 / 669 | 446 / 595 | 456 / 554 | 347 / 537 | 326 / 474 | 318 / 448 | - | - | - |
| Quartile Ranking | 1 | 3 | 1 | 1 | 1 | 1 | 3 | 4 | 3 | 3 | 3 | - | - | - |
| Return % | May | Jun | Jul | Aug | Sep | Oct | Nov | Dec | Jan | Feb | Mar | Apr |
|---|---|---|---|---|---|---|---|---|---|---|---|---|
| Fund | -2.93% | 2.83% | 0.79% | -2.01% | -2.91% | -1.87% | 8.28% | 2.72% | 2.04% | 1.65% | 3.13% | -1.38% |
| Benchmark | -4.95% | 3.36% | 2.58% | -1.37% | -3.33% | -3.21% | 7.48% | 3.91% | 0.55% | 1.82% | 4.14% | -1.82% |
16.64% (April 2020)
-18.46% (March 2020)
| Return % | 2014 | 2015 | 2016 | 2017 | 2018 | 2019 | 2020 | 2021 | 2022 | 2023 |
|---|---|---|---|---|---|---|---|---|---|---|
| Fund | - | - | - | 7.06% | -9.56% | 22.55% | 4.23% | 17.28% | -8.82% | 14.06% |
| Benchmark | 10.55% | -8.32% | 21.08% | 9.10% | -8.89% | 22.88% | 5.60% | 25.09% | -5.84% | 11.75% |
| Category Average | 9.54% | -6.15% | 16.46% | 6.89% | -9.47% | 19.21% | 3.42% | 23.26% | -4.82% | 9.85% |
| Quartile Ranking | - | - | - | 3 | 3 | 1 | 2 | 4 | 4 | 1 |
| Category Rank | - | - | - | 237/ 440 | 248/ 466 | 123/ 514 | 260/ 550 | 553/ 585 | 555/ 652 | 84/ 692 |
22.55% (2019)
-9.56% (2018)
| Name | Percent |
|---|---|
| Canadian Equity | 99.37 |
| Income Trust Units | 0.33 |
| Cash and Equivalents | 0.16 |
| US Equity | 0.15 |
| Other | -0.01 |
| Name | Percent |
|---|---|
| Financial Services | 25.94 |
| Consumer Services | 20.39 |
| Basic Materials | 15.30 |
| Technology | 11.23 |
| Industrial Services | 9.25 |
| Other | 17.89 |
| Name | Percent |
|---|---|
| North America | 100.00 |
| Name | Percent |
|---|---|
| Mackenzie Max Diversification Canada Idx ETF (MKC) | 99.84 |
| Cash and Cash Equivalents | 0.16 |
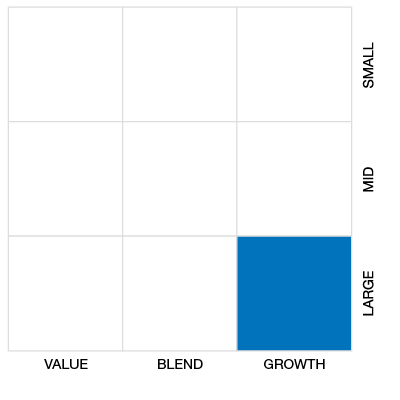

Mackenzie Maximum Diversification Canada Index Fund Series A
Median
Other - Canadian Equity
| Standard Deviation | 12.64% | 16.29% | - |
|---|---|---|---|
| Beta | 0.88% | 0.97% | - |
| Alpha | -0.01% | -0.01% | - |
| Rsquared | 0.88% | 0.87% | - |
| Sharpe | 0.30% | 0.40% | - |
| Sortino | 0.43% | 0.49% | - |
| Treynor | 0.04% | 0.07% | - |
| Tax Efficiency | 78.64% | 85.34% | - |
| Volatility |

|

|
- |

| Key Ratio | 1 Yr | 3 Yr | 5 Yr | 10 Yr |
|---|---|---|---|---|
| Standard Deviation | 11.39% | 12.64% | 16.29% | - |
| Beta | 0.84% | 0.88% | 0.97% | - |
| Alpha | 0.03% | -0.01% | -0.01% | - |
| Rsquared | 0.91% | 0.88% | 0.87% | - |
| Sharpe | 0.49% | 0.30% | 0.40% | - |
| Sortino | 1.29% | 0.43% | 0.49% | - |
| Treynor | 0.07% | 0.04% | 0.07% | - |
| Tax Efficiency | 96.01% | 78.64% | 85.34% | - |
The E, S, and G scores are averaged for each security in the portfolio, to arrive at an ESG score for each security. We take the portfolio weighted average of the ESG scores for each fund and rank them against their peers to arrive at the Fundata ESG Score from 0-100.
Three scores under the Environment bucket are averaged to yield the Fundata Environment Score for each fund from 0-100: (1) Pollution Prevention, (2) Environmental Transparency, (3) Resource Efficiency.
Six scores under the Social bucket are averaged to yield the Fundata Social Score for each fund from 0-100. (1) Compensation and Satisfaction, (2) Diversity and Rights, (3) Education and Work Conditions, (4) Community and Charity, (5) Human Rights, (6) Sustainability Integration.
Three scores under the governance bucket are averaged to yield the Fundata Governance Score for each fund from 0-100: (1) Board Effectiveness, (2) Management Ethics, (3) Disclosure and Accountability.
Powered by OWL Analytics. For more information, please contact Fundata Canada.
| Start Date | June 27, 2016 |
|---|---|
| Instrument Type | Mutual Fund |
| Share Class | Commission Based Advice |
| Legal Status | Trust |
| Sales Status | Open |
| Currency | CAD |
| Distribution Frequency | Annual |
| Assets ($mil) | $28 |
| FundServ Code | Load Code | Sales Status |
|---|---|---|
| MFC8507 | ||
| MFC8508 | ||
| MFC8509 |
The Fund seeks long-term capital growth by investing in equity securities of Canadian companies. The Fund will invest in a manner that aims to enhance the diversification of its investments. The Fund will pursue this objective by investing all or a portion of its assets in a manner that tracks the TOBAM Maximum Diversification Canada Index (the “TOBAM Index”), or a substantially similar index, and may also invest in other securities and/or investment funds.
The Fund will generally invest substantially all its assets in a manner that tracks the TOBAM Index. Currently, the Fund intends to track the TOBAM Index by investing in Mackenzie Maximum Diversification Canada Index ETF and/or by investing in the constituent securities of the TOBAM Index in approximately the same proportion as they are reflected in the TOBAM Index.
| Name | Start Date |
|---|---|
| Eric Ng | 08-03-2021 |
| Fund Manager | Mackenzie Financial Corporation |
|---|---|
| Advisor | Mackenzie Financial Corporation |
| Custodian | Canadian Imperial Bank of Commerce |
| Registrar | Mackenzie Financial Corporation |
| Distributor | - |
| Auditor | Deloitte LLP |
| RSP Eligible | Yes |
|---|---|
| PAC Allowed | Yes |
| PAC Initial Investment | 50 |
| PAC Subsequent | 50 |
| SWP Allowed | No |
| SWP Min Balance | - |
| SWP Min Withdrawal | - |
| MER | 1.89% |
|---|---|
| Management Fee | 1.50% |
| Load | Choice of Front or No Load |
| FE Max | 5.00% |
| DSC Max | 5.50% |
| Trailer Fee Max (FE) | - |
| Trailer Fee Max (DSC) | 1.00% |
| Trailer Fee Max (NL) | - |
| Trailer Fee Max (LL) | - |
Join Fund Library now and get free access to personalized features to help you manage your investments.
 Fund Library