Join Fund Library now and get free access to personalized features to help you manage your investments.
Canadian Equity Balanced
 Click for more information on Fundata’s FundGrade
Click for more information on Fundata’s FundGrade.
 Click for more information on Fundata’s ESG Grade
Click for more information on Fundata’s ESG Grade.

2012
Click for more information on Fundata’s FundGrade
|
NAVPS (05-02-2024) |
$14.76 |
|---|---|
| Change |
-$0.07
(-0.46%)
|
As at March 31, 2024
As at February 29, 2024
As at February 29, 2024
Inception Return (December 31, 2005): 8.16%
| Row Heading | Return | Annualized Return | ||||||||||||
|---|---|---|---|---|---|---|---|---|---|---|---|---|---|---|
| 1 Mth | 3 Mth | 6 Mth | YTD | 1 Yr | 2 Yr | 3 Yr | 4 Yr | 5 Yr | 6 Yr | 7 Yr | 8 Yr | 9 Yr | 10 Yr | |
| Fund | 3.09% | 6.30% | 11.58% | 6.30% | 13.35% | 5.13% | 7.02% | 19.89% | 8.82% | 7.63% | 6.46% | 7.69% | 6.57% | 5.27% |
| Benchmark | 3.22% | 4.61% | 13.14% | 4.61% | 10.92% | 3.03% | 6.47% | 12.42% | 7.64% | 7.62% | 6.76% | 7.65% | 6.20% | 6.37% |
| Category Average | 1.89% | 12.31% | 12.31% | 4.51% | 10.27% | 3.64% | 5.44% | 10.47% | 6.11% | 5.79% | 5.14% | 5.88% | 4.79% | 5.04% |
| Category Rank | 33 / 377 | 38 / 376 | 311 / 375 | 38 / 376 | 81 / 373 | 111 / 370 | 95 / 361 | 7 / 335 | 33 / 329 | 51 / 307 | 65 / 281 | 38 / 269 | 46 / 258 | 142 / 238 |
| Quartile Ranking | 1 | 1 | 4 | 1 | 1 | 2 | 2 | 1 | 1 | 1 | 1 | 1 | 1 | 3 |
| Return % | Apr | May | Jun | Jul | Aug | Sep | Oct | Nov | Dec | Jan | Feb | Mar |
|---|---|---|---|---|---|---|---|---|---|---|---|---|
| Fund | 0.24% | -2.34% | 1.34% | 4.30% | 0.23% | -2.04% | -1.96% | 3.76% | 3.18% | 1.57% | 1.52% | 3.09% |
| Benchmark | 2.40% | -4.11% | 2.51% | 1.67% | -1.08% | -3.16% | -2.30% | 6.66% | 3.79% | 0.07% | 1.27% | 3.22% |
12.92% (April 2020)
-24.98% (March 2020)
| Return % | 2014 | 2015 | 2016 | 2017 | 2018 | 2019 | 2020 | 2021 | 2022 | 2023 |
|---|---|---|---|---|---|---|---|---|---|---|
| Fund | -2.70% | 0.91% | 12.92% | 5.56% | -12.05% | 16.91% | 8.03% | 21.85% | -3.42% | 8.02% |
| Benchmark | 10.25% | -5.39% | 15.95% | 7.50% | -6.34% | 18.83% | 6.85% | 17.62% | -7.12% | 10.48% |
| Category Average | 8.24% | -2.09% | 10.63% | 6.12% | -6.63% | 14.36% | 4.77% | 15.38% | -7.74% | 9.70% |
| Quartile Ranking | 4 | 2 | 2 | 3 | 4 | 1 | 2 | 1 | 1 | 4 |
| Category Rank | 231/ 232 | 99/ 258 | 79/ 266 | 182/ 278 | 300/ 307 | 68/ 327 | 110/ 335 | 43/ 361 | 48/ 369 | 297/ 373 |
21.85% (2021)
-12.05% (2018)
| Name | Percent |
|---|---|
| Canadian Equity | 75.33 |
| Income Trust Units | 9.88 |
| Cash and Equivalents | 9.13 |
| Canadian Corporate Bonds | 3.35 |
| Foreign Corporate Bonds | 1.68 |
| Other | 0.63 |
| Name | Percent |
|---|---|
| Energy | 25.52 |
| Financial Services | 20.44 |
| Real Estate | 13.54 |
| Cash and Cash Equivalent | 9.13 |
| Fixed Income | 5.64 |
| Other | 25.73 |
| Name | Percent |
|---|---|
| North America | 99.98 |
| Other | 0.02 |
| Name | Percent |
|---|---|
| BANK OF NOVA SCOTIA TD 4.85% 01-Mar-2024 | 6.94 |
| goeasy Ltd | 4.15 |
| Mullen Group Ltd | 4.01 |
| EQB Inc | 3.78 |
| Alaris Equity Partners Income Trust - Units | 3.65 |
| Exchange Income Corp | 3.55 |
| Canadian Western Bank | 3.45 |
| Superior Plus Corp | 3.18 |
| KIPLING ST INC KIP1105 CL M | 3.04 |
| Pollard Banknote Ltd | 3.03 |
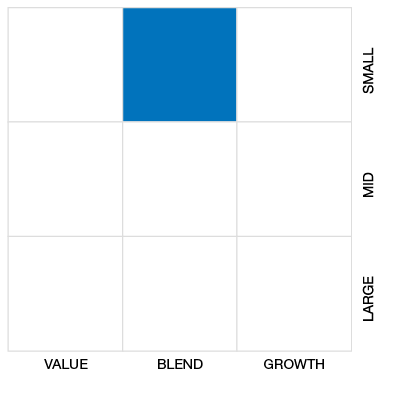

NCM Income Growth Class Series A
Median
Other - Canadian Equity Balanced
| Standard Deviation | 10.51% | 17.20% | 14.46% |
|---|---|---|---|
| Beta | 0.81% | 1.20% | 1.16% |
| Alpha | 0.02% | 0.00% | -0.02% |
| Rsquared | 0.73% | 0.77% | 0.65% |
| Sharpe | 0.45% | 0.47% | 0.34% |
| Sortino | 0.62% | 0.54% | 0.30% |
| Treynor | 0.06% | 0.07% | 0.04% |
| Tax Efficiency | 75.10% | 79.78% | 62.50% |
| Volatility |

|

|
|

| Key Ratio | 1 Yr | 3 Yr | 5 Yr | 10 Yr |
|---|---|---|---|---|
| Standard Deviation | 8.00% | 10.51% | 17.20% | 14.46% |
| Beta | 0.63% | 0.81% | 1.20% | 1.16% |
| Alpha | 0.06% | 0.02% | 0.00% | -0.02% |
| Rsquared | 0.74% | 0.73% | 0.77% | 0.65% |
| Sharpe | 1.02% | 0.45% | 0.47% | 0.34% |
| Sortino | 2.41% | 0.62% | 0.54% | 0.30% |
| Treynor | 0.13% | 0.06% | 0.07% | 0.04% |
| Tax Efficiency | 85.39% | 75.10% | 79.78% | 62.50% |
The E, S, and G scores are averaged for each security in the portfolio, to arrive at an ESG score for each security. We take the portfolio weighted average of the ESG scores for each fund and rank them against their peers to arrive at the Fundata ESG Score from 0-100.
Three scores under the Environment bucket are averaged to yield the Fundata Environment Score for each fund from 0-100: (1) Pollution Prevention, (2) Environmental Transparency, (3) Resource Efficiency.
Six scores under the Social bucket are averaged to yield the Fundata Social Score for each fund from 0-100. (1) Compensation and Satisfaction, (2) Diversity and Rights, (3) Education and Work Conditions, (4) Community and Charity, (5) Human Rights, (6) Sustainability Integration.
Three scores under the governance bucket are averaged to yield the Fundata Governance Score for each fund from 0-100: (1) Board Effectiveness, (2) Management Ethics, (3) Disclosure and Accountability.
Powered by OWL Analytics. For more information, please contact Fundata Canada.
| Start Date | December 31, 2005 |
|---|---|
| Instrument Type | Mutual Fund |
| Share Class | Commission Based Advice |
| Legal Status | Corporation |
| Sales Status | Capped |
| Currency | CAD |
| Distribution Frequency | Monthly |
| Assets ($mil) | - |
| FundServ Code | Load Code | Sales Status |
|---|---|---|
| NRP501 | ||
| NRP502 |
The Fund is designed to provide investors with a stable monthly stream of cash distributions, which shall be determined on an annual basis by the Manager, and the potential for long term capital appreciation by investing in small and mid capitalization high yield securities.
The Fund uses a value approach to high yield investments as a primary method to securities selection. This means searching for organizations that are able to maintain and grow their distributions. In addition we will look for organizations offering superior long-term earnings and cash flow per share growth, organizations exhibiting a strong position in the markets in which they operate, quality management, and balance sheet strength.
| Name | Start Date |
|---|---|
| Cumberland Investment Counsel Inc. | 05-20-2022 |
| NCM Asset Management Ltd. | 11-15-2022 |
| Fund Manager | NCM Asset Management Ltd. |
|---|---|
| Advisor | NCM Asset Management Ltd. |
| Custodian | CIBC Mellon Trust Company |
| Registrar | CIBC Mellon Global Securities Services Company |
| Distributor | - |
| Auditor | KPMG LLP, Chartered Accountants |
| RSP Eligible | Yes |
|---|---|
| PAC Allowed | Yes |
| PAC Initial Investment | 5,000 |
| PAC Subsequent | 100 |
| SWP Allowed | Yes |
| SWP Min Balance | 0 |
| SWP Min Withdrawal | 0 |
| MER | 2.25% |
|---|---|
| Management Fee | 1.65% |
| Load | Choice of Front or No Load |
| FE Max | 5.00% |
| DSC Max | 3.00% |
| Trailer Fee Max (FE) | 0.65% |
| Trailer Fee Max (DSC) | - |
| Trailer Fee Max (NL) | - |
| Trailer Fee Max (LL) | - |
Join Fund Library now and get free access to personalized features to help you manage your investments.
 Fund Library