Join Fund Library now and get free access to personalized features to help you manage your investments.
Cdn Small/Mid Cap Equity
 Click for more information on Fundata’s FundGrade
Click for more information on Fundata’s FundGrade.
 Click for more information on Fundata’s ESG Grade
Click for more information on Fundata’s ESG Grade.

2020, 2019, 2017, 2016, 2015
Click for more information on Fundata’s FundGrade
|
NAVPS (05-02-2024) |
$20.91 |
|---|---|
| Change |
-$0.05
(-0.26%)
|
As at March 31, 2024
As at March 31, 2024
As at February 29, 2024
Inception Return (January 01, 1996): 9.77%
| Row Heading | Return | Annualized Return | ||||||||||||
|---|---|---|---|---|---|---|---|---|---|---|---|---|---|---|
| 1 Mth | 3 Mth | 6 Mth | YTD | 1 Yr | 2 Yr | 3 Yr | 4 Yr | 5 Yr | 6 Yr | 7 Yr | 8 Yr | 9 Yr | 10 Yr | |
| Fund | 1.67% | 7.61% | 20.92% | 7.61% | 18.18% | 3.17% | 1.76% | 15.53% | 8.75% | 7.46% | 5.92% | 7.49% | 6.76% | 6.52% |
| Benchmark | 7.49% | 7.92% | 14.37% | 7.92% | 8.22% | -2.72% | 3.99% | 22.48% | 7.82% | 6.15% | 4.23% | 7.10% | 5.60% | 3.95% |
| Category Average | 2.61% | 14.11% | 14.11% | 6.51% | 10.12% | 0.74% | 4.35% | 17.73% | 7.77% | 6.09% | 4.99% | 6.38% | 4.84% | 4.30% |
| Category Rank | 150 / 219 | 97 / 216 | 13 / 215 | 97 / 216 | 23 / 215 | 69 / 213 | 151 / 203 | 140 / 195 | 93 / 187 | 84 / 179 | 84 / 169 | 75 / 167 | 48 / 143 | 44 / 138 |
| Quartile Ranking | 3 | 2 | 1 | 2 | 1 | 2 | 3 | 3 | 2 | 2 | 2 | 2 | 2 | 2 |
| Return % | Apr | May | Jun | Jul | Aug | Sep | Oct | Nov | Dec | Jan | Feb | Mar |
|---|---|---|---|---|---|---|---|---|---|---|---|---|
| Fund | -0.47% | 0.91% | 1.99% | 3.69% | -2.93% | -5.21% | -2.27% | 9.46% | 5.05% | 2.54% | 3.22% | 1.67% |
| Benchmark | -1.16% | -4.06% | 0.59% | 6.09% | -1.31% | -5.24% | -2.58% | 4.84% | 3.76% | -0.37% | 0.77% | 7.49% |
15.91% (April 2020)
-23.89% (March 2020)
| Return % | 2014 | 2015 | 2016 | 2017 | 2018 | 2019 | 2020 | 2021 | 2022 | 2023 |
|---|---|---|---|---|---|---|---|---|---|---|
| Fund | 10.93% | 0.93% | 18.46% | 3.11% | -11.50% | 27.48% | 17.85% | 16.83% | -19.87% | 10.94% |
| Benchmark | -2.34% | -13.31% | 38.48% | 2.75% | -18.17% | 15.84% | 12.87% | 20.27% | -9.29% | 4.79% |
| Category Average | 3.45% | -6.13% | 18.01% | 3.43% | -15.15% | 16.59% | 11.91% | 22.35% | -11.32% | 6.49% |
| Quartile Ranking | 1 | 1 | 3 | 3 | 1 | 1 | 2 | 4 | 4 | 1 |
| Category Rank | 33/ 137 | 30/ 142 | 101/ 164 | 85/ 169 | 38/ 179 | 22/ 186 | 66/ 191 | 181/ 203 | 175/ 212 | 50/ 215 |
27.48% (2019)
-19.87% (2022)
| Name | Percent |
|---|---|
| Canadian Equity | 91.87 |
| Cash and Equivalents | 4.43 |
| International Equity | 2.28 |
| Income Trust Units | 1.42 |
| Name | Percent |
|---|---|
| Financial Services | 18.93 |
| Energy | 15.25 |
| Technology | 12.58 |
| Real Estate | 11.42 |
| Consumer Services | 10.45 |
| Other | 31.37 |
| Name | Percent |
|---|---|
| North America | 97.72 |
| Latin America | 2.28 |
| Name | Percent |
|---|---|
| Trisura Group Ltd | 5.16 |
| Mainstreet Equity Corp | 4.65 |
| Converge Technology Solutions Corp | 4.63 |
| TerraVest Industries Inc | 4.45 |
| Element Fleet Management Corp | 4.34 |
| Canada Government 0.00% 20-Jun-2024 | 4.22 |
| EQB Inc | 3.66 |
| Sleep Country Canada Holdings Inc | 3.61 |
| MATTR CORP | 3.55 |
| Boyd Group Services Inc | 3.54 |

BMO Enterprise Fund Advisor Series
Median
Other - Cdn Small/Mid Cap Equity
| Standard Deviation | 15.69% | 19.06% | 15.44% |
|---|---|---|---|
| Beta | 0.61% | 0.63% | 0.58% |
| Alpha | 0.00% | 0.04% | 0.04% |
| Rsquared | 0.42% | 0.67% | 0.58% |
| Sharpe | 0.02% | 0.44% | 0.40% |
| Sortino | 0.00% | 0.52% | 0.41% |
| Treynor | 0.01% | 0.13% | 0.11% |
| Tax Efficiency | - | 77.18% | 71.24% |
| Volatility |

|

|

|

| Key Ratio | 1 Yr | 3 Yr | 5 Yr | 10 Yr |
|---|---|---|---|---|
| Standard Deviation | 13.54% | 15.69% | 19.06% | 15.44% |
| Beta | 0.69% | 0.61% | 0.63% | 0.58% |
| Alpha | 0.12% | 0.00% | 0.04% | 0.04% |
| Rsquared | 0.51% | 0.42% | 0.67% | 0.58% |
| Sharpe | 0.95% | 0.02% | 0.44% | 0.40% |
| Sortino | 2.14% | 0.00% | 0.52% | 0.41% |
| Treynor | 0.19% | 0.01% | 0.13% | 0.11% |
| Tax Efficiency | 89.81% | - | 77.18% | 71.24% |
The E, S, and G scores are averaged for each security in the portfolio, to arrive at an ESG score for each security. We take the portfolio weighted average of the ESG scores for each fund and rank them against their peers to arrive at the Fundata ESG Score from 0-100.
Three scores under the Environment bucket are averaged to yield the Fundata Environment Score for each fund from 0-100: (1) Pollution Prevention, (2) Environmental Transparency, (3) Resource Efficiency.
Six scores under the Social bucket are averaged to yield the Fundata Social Score for each fund from 0-100. (1) Compensation and Satisfaction, (2) Diversity and Rights, (3) Education and Work Conditions, (4) Community and Charity, (5) Human Rights, (6) Sustainability Integration.
Three scores under the governance bucket are averaged to yield the Fundata Governance Score for each fund from 0-100: (1) Board Effectiveness, (2) Management Ethics, (3) Disclosure and Accountability.
Powered by OWL Analytics. For more information, please contact Fundata Canada.
| Start Date | January 01, 1996 |
|---|---|
| Instrument Type | Mutual Fund |
| Share Class | Commission Based Advice |
| Legal Status | Trust |
| Sales Status | Capped |
| Currency | CAD |
| Distribution Frequency | Annual |
| Assets ($mil) | $177 |
| FundServ Code | Load Code | Sales Status |
|---|---|---|
| BMO85179 | ||
| BMO86949 | ||
| BMO87579 |
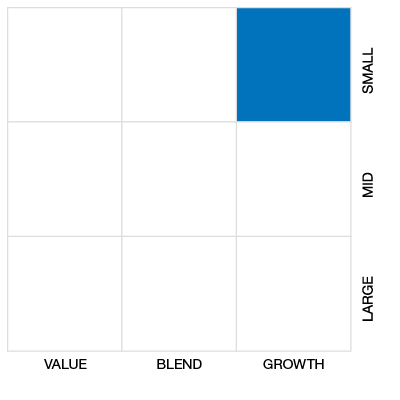
This fund's objective is to provide long-term growth through capital appreciation, by investing primarily in a portfolio of Canadian equities and equity-related securities issued by companies with small to medium market capitalization.
These are the strategies the portfolio manager uses to try to achieve the fund’s objective: invests in equity holdings chosen through a bottom-up selection process which emphasizes growth in earnings and sales, while also taking into account the valuations of the companies so chosen. This style of investment is sometimes described as a blend of growth and value methodologies.
| Name | Start Date |
|---|---|
| Jeff Mo | 01-01-2016 |
| Fund Manager | BMO Investments Inc. |
|---|---|
| Advisor | Mawer Investment Management Ltd. |
| Custodian | CIBC Mellon Trust Company |
| Registrar | BMO Investments Inc. |
| Distributor | BMO Investments Inc. |
| Auditor | PriceWaterhouseCoopers LLP |
| RSP Eligible | Yes |
|---|---|
| PAC Allowed | Yes |
| PAC Initial Investment | 50 |
| PAC Subsequent | 50 |
| SWP Allowed | Yes |
| SWP Min Balance | 10,000 |
| SWP Min Withdrawal | 100 |
| MER | 2.60% |
|---|---|
| Management Fee | 2.35% |
| Load | Choice of Front or No Load |
| FE Max | 5.00% |
| DSC Max | 6.00% |
| Trailer Fee Max (FE) | 1.00% |
| Trailer Fee Max (DSC) | 0.50% |
| Trailer Fee Max (NL) | - |
| Trailer Fee Max (LL) | - |
Join Fund Library now and get free access to personalized features to help you manage your investments.
 Fund Library