Try Fund Library Premium
For Free with a 30 day trial!
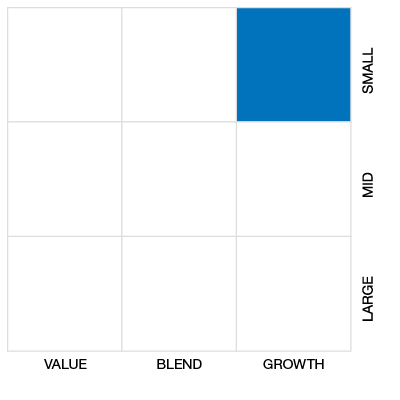
Cdn Small/Mid Cap Equity
 Click for more information on Fundata’s FundGrade
Click for more information on Fundata’s FundGrade.
|
Close (08-08-2025) |
$24.21 |
|---|---|
| Change |
-$0.05
(-0.21%)
|
| Open | $24.36 |
|---|---|
| Day Range | $24.21 - $24.38 |
| Volume | 3,257 |
As at June 30, 2025
As at June 30, 2025
Inception Return (May 14, 2007): 3.30%
| Row Heading | Return | Annualized Return | ||||||||||||
|---|---|---|---|---|---|---|---|---|---|---|---|---|---|---|
| 1 Mth | 3 Mth | 6 Mth | YTD | 1 Yr | 2 Yr | 3 Yr | 4 Yr | 5 Yr | 6 Yr | 7 Yr | 8 Yr | 9 Yr | 10 Yr | |
| Fund | 6.12% | 11.62% | 12.47% | 12.47% | 22.45% | 18.18% | 13.66% | 6.05% | 14.84% | 10.35% | 7.52% | 7.27% | 6.85% | 7.12% |
| Benchmark | 6.19% | 11.75% | 12.74% | 12.74% | 23.10% | 18.68% | 14.06% | 6.34% | 15.06% | 10.43% | 7.57% | 7.29% | 6.89% | 7.18% |
| Category Average | 4.33% | 7.19% | 7.19% | 7.19% | 16.56% | 13.75% | 11.82% | 5.54% | 12.66% | 9.17% | 7.06% | 6.66% | 6.75% | 5.95% |
| Category Rank | 23 / 203 | 137 / 202 | 5 / 202 | 5 / 202 | 39 / 202 | 26 / 198 | 76 / 196 | 81 / 189 | 57 / 180 | 77 / 178 | 90 / 171 | 85 / 167 | 99 / 157 | 69 / 136 |
| Quartile Ranking | 1 | 3 | 1 | 1 | 1 | 1 | 2 | 2 | 2 | 2 | 3 | 3 | 3 | 3 |
| Return % | Jul | Aug | Sep | Oct | Nov | Dec | Jan | Feb | Mar | Apr | May | Jun |
|---|---|---|---|---|---|---|---|---|---|---|---|---|
| Fund | 5.75% | -1.27% | 3.73% | 1.30% | 2.65% | -3.31% | 0.60% | -2.27% | 2.49% | -1.84% | 7.15% | 6.12% |
| Benchmark | 5.81% | -1.26% | 3.80% | 1.39% | 2.69% | -3.30% | 0.65% | -2.27% | 2.56% | -1.83% | 7.20% | 6.19% |
25.22% (April 2020)
-29.15% (March 2020)
| Return % | 2015 | 2016 | 2017 | 2018 | 2019 | 2020 | 2021 | 2022 | 2023 | 2024 |
|---|---|---|---|---|---|---|---|---|---|---|
| Fund | -13.50% | 38.18% | 2.64% | -18.04% | 16.14% | 13.36% | 20.19% | -9.22% | 4.31% | 18.41% |
| Benchmark | -13.31% | 38.48% | 2.75% | -18.17% | 15.84% | 12.87% | 20.27% | -9.29% | 4.79% | 18.83% |
| Category Average | -6.13% | 18.01% | 3.43% | -15.15% | 16.59% | 11.91% | 22.35% | -11.32% | 6.49% | 16.84% |
| Quartile Ranking | 4 | 1 | 3 | 4 | 3 | 3 | 3 | 2 | 3 | 2 |
| Category Rank | 127/ 132 | 1/ 154 | 87/ 159 | 131/ 168 | 126/ 175 | 105/ 180 | 135/ 188 | 74/ 196 | 131/ 198 | 91/ 199 |
38.18% (2016)
-18.04% (2018)
| Name | Percent |
|---|---|
| Canadian Equity | 88.27 |
| Income Trust Units | 8.13 |
| International Equity | 1.90 |
| US Equity | 1.69 |
| Other | 0.01 |
| Name | Percent |
|---|---|
| Basic Materials | 37.09 |
| Energy | 18.17 |
| Real Estate | 11.23 |
| Financial Services | 6.98 |
| Healthcare | 4.73 |
| Other | 21.80 |
| Name | Percent |
|---|---|
| North America | 98.10 |
| Asia | 1.76 |
| Europe | 0.14 |
| Name | Percent |
|---|---|
| New Gold Inc | 2.11 |
| First Majestic Silver Corp | 1.89 |
| OceanaGold Corp | 1.76 |
| Peyto Exploration & Development Corp | 1.52 |
| MDA Space Ltd | 1.51 |
| Torex Gold Resources Inc | 1.51 |
| K92 Mining Inc | 1.45 |
| Dundee Precious Metals Inc | 1.44 |
| SSR Mining Inc | 1.39 |
| Sandstorm Gold Ltd | 1.23 |

iShares S&P/TSX SmallCap Index ETF
Median
Other - Cdn Small/Mid Cap Equity
| Standard Deviation | 14.16% | 16.98% | 19.88% |
|---|---|---|---|
| Beta | 1.00% | 1.00% | 1.00% |
| Alpha | 0.00% | 0.00% | 0.00% |
| Rsquared | 1.00% | 1.00% | 1.00% |
| Sharpe | 0.70% | 0.75% | 0.36% |
| Sortino | 1.42% | 1.28% | 0.44% |
| Treynor | 0.10% | 0.13% | 0.07% |
| Tax Efficiency | 93.10% | 93.43% | 88.02% |
| Volatility |

|

|
|

| Key Ratio | 1 Yr | 3 Yr | 5 Yr | 10 Yr |
|---|---|---|---|---|
| Standard Deviation | 12.13% | 14.16% | 16.98% | 19.88% |
| Beta | 0.99% | 1.00% | 1.00% | 1.00% |
| Alpha | 0.00% | 0.00% | 0.00% | 0.00% |
| Rsquared | 1.00% | 1.00% | 1.00% | 1.00% |
| Sharpe | 1.46% | 0.70% | 0.75% | 0.36% |
| Sortino | 3.57% | 1.42% | 1.28% | 0.44% |
| Treynor | 0.18% | 0.10% | 0.13% | 0.07% |
| Tax Efficiency | 95.33% | 93.10% | 93.43% | 88.02% |
| Start Date | May 14, 2007 |
|---|---|
| Instrument Type | Exchange Traded Fund |
| Share Class | Do-It-Yourself |
| Legal Status | Trust |
| Sales Status | Open |
| Currency | CAD |
| Distribution Frequency | Quarterly |
| Assets ($mil) | $132 |
| 52 Week High | $24.43 |
| 52 Week Low | $18.13 |
| Annual Dividend | $0.45 |
| Annual Yield | - |
| Index | S&P/TSX SmallCap Index |
| Shares Outstanding | - |
| Registered Plan Eligible | Yes |
| Exposure | 1x performance |
|---|---|
| Asset Class High | - |
| Asset Class Medium | - |
| Asset Class Low | - |
| Leveraged | - |
| Inverse | - |
| Advisor Series | - |
| Covered Call Strategy | No |
The iShares Canadian Equity Funds seek to provide long-term capital growth by replicating, to the extent possible, the performance of the applicable Canadian Equity Fund Index, net of expenses.
The investment strategy of each iShares Canadian Equity Fund, other than XVX, is to invest primarily in and hold the Index Securities of the applicable Canadian Equity Fund Index in substantially the same proportion as they are reflected in the applicable Canadian Equity Fund Index.
| Portfolio Manager |
BlackRock Asset Management Canada Limited |
|---|---|
| Sub-Advisor |
BlackRock Institutional Trust Company, N.A. |
| Fund Manager |
BlackRock Asset Management Canada Limited |
|---|---|
| Custodian |
- |
| Registrar |
- |
| Distributor |
- |
| MER | 0.60% |
|---|---|
| Management Fee | 0.55% |
Try Fund Library Premium
For Free with a 30 day trial!
 Fund Library