Try Fund Library Premium
For Free with a 30 day trial!
Geographic Equity
 Click for more information on Fundata’s ESG Grade
Click for more information on Fundata’s ESG Grade.
|
Close (03-19-2026) |
$38.43 |
|---|---|
| Change |
-$0.78
(-1.99%)
|
| Open | $38.77 |
|---|---|
| Day Range | $38.01 - $38.77 |
| Volume | 17,736 |
As at February 28, 2026
As at February 28, 2026
As at February 28, 2026
Inception Return (February 14, 2007): 5.57%
| Row Heading | Return | Annualized Return | ||||||||||||
|---|---|---|---|---|---|---|---|---|---|---|---|---|---|---|
| 1 Mth | 3 Mth | 6 Mth | YTD | 1 Yr | 2 Yr | 3 Yr | 4 Yr | 5 Yr | 6 Yr | 7 Yr | 8 Yr | 9 Yr | 10 Yr | |
| Fund | 11.49% | 18.28% | 31.55% | 16.59% | 54.48% | 28.82% | 34.19% | 28.84% | 24.26% | 23.60% | 18.84% | 15.23% | 15.08% | 15.87% |
| Benchmark | 7.72% | 10.06% | 21.64% | 8.62% | 38.79% | 30.37% | 22.89% | 16.36% | 17.10% | 16.70% | 14.94% | 13.89% | 12.66% | 13.67% |
| Category Average | 6.02% | 13.17% | 13.17% | 7.32% | 23.95% | 12.15% | 17.18% | 11.54% | 9.78% | 12.26% | 10.65% | 7.79% | 9.41% | 10.55% |
| Category Rank | - | - | - | - | - | - | - | - | - | - | - | - | - | - |
| Quartile Ranking | - | - | - | - | - | - | - | - | - | - | - | - | - | - |
| Return % | Mar | Apr | May | Jun | Jul | Aug | Sep | Oct | Nov | Dec | Jan | Feb |
|---|---|---|---|---|---|---|---|---|---|---|---|---|
| Fund | 0.68% | -0.68% | 5.24% | 1.13% | 4.06% | 6.04% | 3.14% | 6.06% | 1.67% | 1.45% | 4.58% | 11.49% |
| Benchmark | -1.51% | -0.10% | 5.56% | 2.91% | 1.69% | 4.96% | 5.40% | 0.97% | 3.86% | 1.32% | 0.84% | 7.72% |
12.86% (April 2008)
-24.47% (October 2008)
| Return % | 2016 | 2017 | 2018 | 2019 | 2020 | 2021 | 2022 | 2023 | 2024 | 2025 |
|---|---|---|---|---|---|---|---|---|---|---|
| Fund | -0.51% | 19.94% | -16.38% | 13.84% | -1.48% | 17.83% | 5.61% | 33.78% | 26.19% | 30.32% |
| Benchmark | 21.08% | 9.10% | -8.89% | 22.88% | 5.60% | 25.09% | -5.84% | 11.75% | 21.65% | 31.68% |
| Category Average | 2.24% | 28.39% | -9.85% | 12.16% | 14.68% | 11.64% | -10.77% | 19.30% | 15.57% | 9.22% |
| Quartile Ranking | - | - | - | - | - | - | - | - | - | - |
| Category Rank | - | - | - | - | - | - | - | - | - | - |
33.78% (2023)
-16.38% (2018)
| Name | Percent |
|---|---|
| International Equity | 100.00 |
| Name | Percent |
|---|---|
| Consumer Goods | 20.52 |
| Financial Services | 19.64 |
| Industrial Goods | 14.24 |
| Industrial Services | 11.32 |
| Technology | 6.28 |
| Other | 28.00 |
| Name | Percent |
|---|---|
| Asia | 100.00 |
| Name | Percent |
|---|---|
| Mitsubishi UFJ Financial Group Inc | 4.49 |
| Toyota Motor Corp | 4.44 |
| Sumitomo Mitsui Financial Group Inc | 3.22 |
| Mizuho Financial Group Inc | 2.76 |
| SoftBank Group Corp | 2.29 |
| Honda Motor Co Ltd | 2.11 |
| Mitsubishi Corp | 2.02 |
| Hitachi Ltd | 1.94 |
| Sony Group Corp | 1.83 |
| Mitsui & Co Ltd | 1.46 |
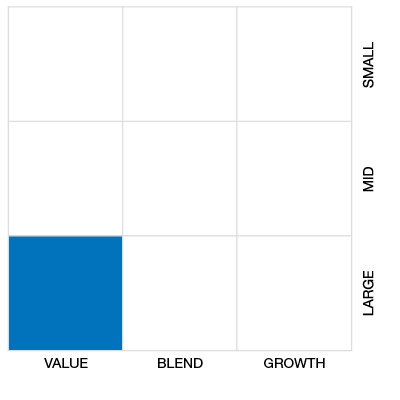

iShares Japan Fundamental Index ETF (CAD-Hedged)
Median
Other - Geographic Equity
| Standard Deviation | 11.60% | 11.87% | 14.61% |
|---|---|---|---|
| Beta | 0.31% | 0.43% | 0.63% |
| Alpha | 0.24% | 0.15% | 0.07% |
| Rsquared | 0.09% | 0.20% | 0.31% |
| Sharpe | 2.30% | 1.67% | 0.96% |
| Sortino | 7.52% | 3.69% | 1.39% |
| Treynor | 0.85% | 0.46% | 0.22% |
| Tax Efficiency | 97.81% | 97.25% | 96.14% |
| Volatility |

|
|

|

| Key Ratio | 1 Yr | 3 Yr | 5 Yr | 10 Yr |
|---|---|---|---|---|
| Standard Deviation | 11.41% | 11.60% | 11.87% | 14.61% |
| Beta | 0.81% | 0.31% | 0.43% | 0.63% |
| Alpha | 0.18% | 0.24% | 0.15% | 0.07% |
| Rsquared | 0.45% | 0.09% | 0.20% | 0.31% |
| Sharpe | 3.72% | 2.30% | 1.67% | 0.96% |
| Sortino | - | 7.52% | 3.69% | 1.39% |
| Treynor | 0.52% | 0.85% | 0.46% | 0.22% |
| Tax Efficiency | 98.31% | 97.81% | 97.25% | 96.14% |
The E, S, and G scores are averaged for each security in the portfolio, to arrive at an ESG score for each security. We take the portfolio weighted average of the ESG scores for each fund and rank them against their peers to arrive at the Fundata ESG Score from 0-100.
Three scores under the Environment bucket are averaged to yield the Fundata Environment Score for each fund from 0-100: (1) Pollution Prevention, (2) Environmental Transparency, (3) Resource Efficiency.
Six scores under the Social bucket are averaged to yield the Fundata Social Score for each fund from 0-100. (1) Compensation and Satisfaction, (2) Diversity and Rights, (3) Education and Work Conditions, (4) Community and Charity, (5) Human Rights, (6) Sustainability Integration.
Three scores under the governance bucket are averaged to yield the Fundata Governance Score for each fund from 0-100: (1) Board Effectiveness, (2) Management Ethics, (3) Disclosure and Accountability.
Powered by OWL Analytics. For more information, please contact Fundata Canada.
| Start Date | February 14, 2007 |
|---|---|
| Instrument Type | Exchange Traded Fund |
| Share Class | Do-It-Yourself |
| Legal Status | Trust |
| Sales Status | Open |
| Currency | CAD |
| Distribution Frequency | Semi Annual |
| Assets ($mil) | $174 |
| 52 Week High | $42.39 |
| 52 Week Low | $22.65 |
| Annual Dividend | $0.54 |
| Annual Yield | - |
| Index | FTSE RAFI Japan Index CAD Hedged |
| Shares Outstanding | - |
| Registered Plan Eligible | Yes |
| Exposure | 1x performance |
|---|---|
| Asset Class High | - |
| Asset Class Medium | - |
| Asset Class Low | - |
| Leveraged | - |
| Inverse | - |
| Advisor Series | - |
| Covered Call Strategy | No |
iShares Japan Fundamental Index Fund seeks to track the FTSE RAFI Japan C$ Hedged Index, less fees and expenses. CJP selects constituents by 3 accounting factors (tracked over 5 consecutive years) including: total cash dividends, free cash flow and total sales, as well as, current-period book equity value. CJP offers lower costs with a hedged exposure to the Yen, reducing risks for Canadians.
CJP’s current principal investment strategy is to employ a Replicating Strategy. In addition to or as an alternative to this strategy, CJP may invest by employing a Sampling Strategy, by investing in one or more iShares ETFs and/or through the use of derivatives. CJP employs a Currency Hedging Strategy with respect to foreign currency exposure.
| Portfolio Manager |
BlackRock Asset Management Canada Limited |
|---|---|
| Sub-Advisor |
BlackRock Institutional Trust Company, N.A.
|
| Fund Manager |
BlackRock Asset Management Canada Limited |
|---|---|
| Custodian |
State Street Trust Company Canada |
| Registrar |
State Street Trust Company Canada |
| Distributor |
- |
| MER | 0.72% |
|---|---|
| Management Fee | 0.65% |
Try Fund Library Premium
For Free with a 30 day trial!
 Fund Library