Try Fund Library Premium
Free with a 30 day trial!
Gain access to
- Unlimited Watchlists
- Advanced Search Filtering
- Fund Comparisons
- Portfolio Scenarios
- Customizable PDF Reports
- Portfolio Rebalancer new
Global X Asia Semiconductor Index ETF Class A (ACHP : TSX)
Sector Equity
 Click for more information on Fundata’s ESG Grade
Fundata ESG Grade C
Click for more information on Fundata’s ESG Grade.
|
Close (11-11-2026) |
$16.27 |
|---|---|
| Change |
$1.09
(7.18%)
|
| Open | $16.36 |
|---|---|
| Day Range | $16.36 - $16.45 |
| Volume | 2,103 |
As at October 31, 2026
As at October 31, 2026
As at October 31, 2026
 Loading......
Legend
Compare Options
Fund Returns
Inception Return (September 22, 2026): -19.64%
| Row Heading | Return | Annualized Return | ||||||||||||
|---|---|---|---|---|---|---|---|---|---|---|---|---|---|---|
| 1 Mth | 3 Mth | 6 Mth | YTD | 1 Yr | 2 Yr | 3 Yr | 4 Yr | 5 Yr | 6 Yr | 7 Yr | 8 Yr | 9 Yr | 10 Yr | |
| Fund | -19.43% | - | - | - | - | - | - | - | - | - | - | - | - | - |
| Benchmark | 1.24% | 1.64% | 6.00% | 14.37% | 20.35% | 24.48% | 26.95% | 19.73% | 14.34% | 18.09% | 14.94% | 14.72% | 12.55% | 12.44% |
| Category Average | -6.09% | 7.27% | 7.27% | 14.02% | 9.04% | 16.60% | 21.59% | 18.54% | 8.82% | 12.22% | 13.22% | 13.04% | 12.23% | 12.95% |
| Category Rank | - | - | - | - | - | - | - | - | - | - | - | - | - | - |
| Quartile Ranking | - | - | - | - | - | - | - | - | - | - | - | - | - | - |
Monthly Return
| Return % | Nov | Dec | Jan | Feb | Mar | Apr | May | Jun | Jul | Aug | Sep | Oct |
|---|---|---|---|---|---|---|---|---|---|---|---|---|
| Fund | - | - | - | - | - | - | - | - | - | - | - | -19.43% |
| Benchmark | 3.86% | 1.32% | 0.84% | 7.72% | -4.32% | 3.81% | 2.52% | 0.50% | 1.22% | 3.10% | -2.62% | 1.24% |
Best Monthly Return Since Inception
-0.27% (September 2026)
Worst Monthly Return Since Inception
-19.43% (October 2026)
Calendar Return (%)
| Return % | 2016 | 2017 | 2018 | 2019 | 2020 | 2021 | 2022 | 2023 | 2024 | 2025 |
|---|---|---|---|---|---|---|---|---|---|---|
| Fund | - | - | - | - | - | - | - | - | - | - |
| Benchmark | 21.08% | 9.10% | -8.89% | 22.88% | 5.60% | 25.09% | -5.84% | 11.75% | 21.65% | 31.68% |
| Category Average | -0.43% | 20.39% | 1.55% | 22.37% | 29.99% | 15.34% | -25.24% | 26.53% | 20.41% | 15.55% |
| Quartile Ranking | - | - | - | - | - | - | - | - | - | - |
| Category Rank | - | - | - | - | - | - | - | - | - | - |
Best Calendar Return (Last 10 years)
-
Worst Calendar Return (Last 10 years)
-
Asset Allocation
| Name | Percent |
|---|---|
| International Equity | 99.45 |
| Cash and Equivalents | 0.54 |
| Other | 0.01 |
Sector Allocation
| Name | Percent |
|---|---|
| Technology | 99.33 |
| Cash and Cash Equivalent | 0.54 |
| Industrial Goods | 0.12 |
| Other | 0.01 |
Geographic Allocation
| Name | Percent |
|---|---|
| Asia | 99.46 |
| North America | 0.54 |
Top Holdings
| Name | Percent |
|---|---|
| Taiwan Semiconductor Manufactrg Co Ltd - ADR | 21.64 |
| Samsung Electronics Co Ltd | 20.17 |
| SK Hynix Inc | 19.20 |
| MediaTek Inc | 13.94 |
| Kioxia Holdings Corp | 7.48 |
| United Microelectronics Corp | 3.01 |
| Nanya Technology Corp | 2.31 |
| Renesas Electronics Corp | 2.30 |
| GigaDevice Semiconductor Beijing Inc Cl A | 1.62 |
| Montage Technology Co Ltd Cl A | 1.59 |
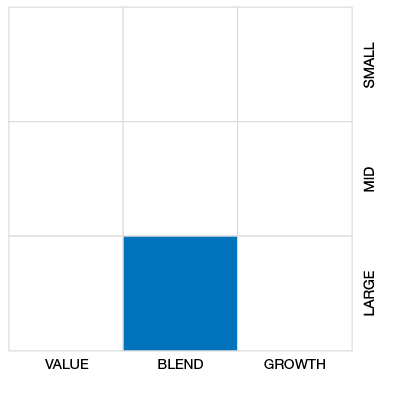
Equity Style
Fixed Income Style

Risk vs Return (3 Yr)
3 Yr Annualized
| Standard Deviation | - | - | - |
|---|---|---|---|
| Beta | - | - | - |
| Alpha | - | - | - |
| Rsquared | - | - | - |
| Sharpe | - | - | - |
| Sortino | - | - | - |
| Treynor | - | - | - |
| Tax Efficiency | - | - | - |
| Volatility | - | - | - |
Risk Rating

Annualized Key Ratio Period Comparison
| Key Ratio | 1 Yr | 3 Yr | 5 Yr | 10 Yr |
|---|---|---|---|---|
| Standard Deviation | - | - | - | - |
| Beta | - | - | - | - |
| Alpha | - | - | - | - |
| Rsquared | - | - | - | - |
| Sharpe | - | - | - | - |
| Sortino | - | - | - | - |
| Treynor | - | - | - | - |
| Tax Efficiency | - | - | - | - |
Fundata ESG Metrics
Fundata ESG Score
The E, S, and G scores are averaged for each security in the portfolio, to arrive at an ESG score for each security. We take the portfolio weighted average of the ESG scores for each fund and rank them against their peers to arrive at the Fundata ESG Score from 0-100.
Fundata E Score
Three scores under the Environment bucket are averaged to yield the Fundata Environment Score for each fund from 0-100: (1) Pollution Prevention, (2) Environmental Transparency, (3) Resource Efficiency.
Fundata S Score
Six scores under the Social bucket are averaged to yield the Fundata Social Score for each fund from 0-100. (1) Compensation and Satisfaction, (2) Diversity and Rights, (3) Education and Work Conditions, (4) Community and Charity, (5) Human Rights, (6) Sustainability Integration.
Fundata G Score
Three scores under the governance bucket are averaged to yield the Fundata Governance Score for each fund from 0-100: (1) Board Effectiveness, (2) Management Ethics, (3) Disclosure and Accountability.
Powered by OWL Analytics. For more information, please contact Fundata Canada.
Fund Details
| Start Date | September 22, 2026 |
|---|---|
| Instrument Type | Exchange Traded Fund |
| Share Class | Do-It-Yourself |
| Legal Status | - |
| Sales Status | Open |
| Currency | CAD |
| Distribution Frequency | Annual |
| Assets ($mil) | $2 |
| 52 Week High | $21.70 |
| 52 Week Low | $13.74 |
| Annual Dividend | - |
| Annual Yield | - |
| Index | - |
| Shares Outstanding | - |
| Registered Plan Eligible | Yes |
ETF Characteristics
| Exposure | - |
|---|---|
| Asset Class High | - |
| Asset Class Medium | - |
| Asset Class Low | - |
| Leveraged | - |
| Inverse | - |
| Advisor Series | - |
| Covered Call Strategy | No |
Investment Objectives
ACHP seeks to replicate, to the extent possible and net of expenses, the performance of an index comprised of leading companies, in developed and emerging Asian markets, involved in the semiconductor industry (currently, the Mirae Asset Asia Semiconductor Index).
Investment Strategy
In order to achieve their investment objectives and obtain direct or indirect exposure to securities of their Underlying Index's Constituent Issuers, the Index ETFs may invest in and hold the securities of Constituent Issuers in substantially the same proportion as they are reflected in the applicable Underlying Index, or may invest in and hold index participation units of exchange traded funds or use derivatives, including but not limited to swap agreements, futures contracts, options on future
Portfolio Management
| Portfolio Manager |
Global X Investments Canada Inc. |
|---|---|
| Sub-Advisor |
- |
Management and Organization
| Fund Manager |
Global X Investments Canada Inc. |
|---|---|
| Custodian |
CIBC Mellon Trust Company |
| Registrar |
TSX Trust Company |
| Distributor |
- |
Fees
| MER | - |
|---|---|
| Management Fee | 0.49% |
Try Fund Library Premium
Free with a 30 day trial!
Gain access to
- Unlimited Watchlists
- Advanced Search Filtering
- Fund Comparisons
- Portfolio Scenarios
- Customizable PDF Reports
- Portfolio Rebalancer new