Try Fund Library Premium
Free with a 30 day trial!
Gain access to
- Unlimited Watchlists
- Advanced Search Filtering
- Fund Comparisons
- Portfolio Scenarios
- Customizable PDF Reports
- Portfolio Rebalancer new
Pender Alternative Multi-Strategy Growth Fund Class F
Alternative Multi-Stratgy
|
NAVPS (07-24-2026) |
$21.16 |
|---|---|
| Change |
-$0.07
(-0.31%)
|
As at June 30, 2026
As at June 30, 2026
No data available
Fund Returns
Inception Return (April 30, 2026): -
| Row Heading | Return | Annualized Return | ||||||||||||
|---|---|---|---|---|---|---|---|---|---|---|---|---|---|---|
| 1 Mth | 3 Mth | 6 Mth | YTD | 1 Yr | 2 Yr | 3 Yr | 4 Yr | 5 Yr | 6 Yr | 7 Yr | 8 Yr | 9 Yr | 10 Yr | |
| Fund | - | - | - | - | - | - | - | - | - | - | - | - | - | - |
| Benchmark | 0.50% | 6.96% | 11.16% | 11.16% | 32.87% | 29.58% | 23.48% | 20.08% | 14.85% | 17.82% | 14.73% | 13.31% | 12.99% | 12.79% |
| Category Average | 0.21% | 4.18% | 5.47% | 5.47% | 13.14% | 7.97% | 7.67% | 6.15% | 4.01% | 5.25% | 4.40% | - | - | - |
| Category Rank | - | - | - | - | - | - | - | - | - | - | - | - | - | - |
| Quartile Ranking | - | - | - | - | - | - | - | - | - | - | - | - | - | - |
Monthly Return
| Return % | Jul | Aug | Sep | Oct | Nov | Dec | Jan | Feb | Mar | Apr | May | Jun |
|---|---|---|---|---|---|---|---|---|---|---|---|---|
| Fund | - | - | - | - | - | - | - | - | - | - | - | - |
| Benchmark | 1.69% | 4.96% | 5.40% | 0.97% | 3.86% | 1.32% | 0.84% | 7.72% | -4.32% | 3.81% | 2.52% | 0.50% |
Best Monthly Return Since Inception
-
Worst Monthly Return Since Inception
-
Calendar Return (%)
| Return % | 2016 | 2017 | 2018 | 2019 | 2020 | 2021 | 2022 | 2023 | 2024 | 2025 |
|---|---|---|---|---|---|---|---|---|---|---|
| Fund | - | - | - | - | - | - | - | - | - | - |
| Benchmark | 21.08% | 9.10% | -8.89% | 22.88% | 5.60% | 25.09% | -5.84% | 11.75% | 21.65% | 31.68% |
| Category Average | - | - | - | - | 4.04% | 6.86% | -5.49% | 4.47% | 5.04% | 9.01% |
| Quartile Ranking | - | - | - | - | - | - | - | - | - | - |
| Category Rank | - | - | - | - | - | - | - | - | - | - |
Best Calendar Return (Last 10 years)
-
Worst Calendar Return (Last 10 years)
-
Asset Allocation
| Name | Percent |
|---|---|
| Canadian Equity | 26.71 |
| US Equity | 4.74 |
| International Equity | 2.77 |
| Cash and Equivalents | 2.05 |
| Foreign Corporate Bonds | 1.06 |
| Other | 62.67 |
Sector Allocation
| Name | Percent |
|---|---|
| Mutual Fund | 62.67 |
| Technology | 12.96 |
| Basic Materials | 3.51 |
| Energy | 3.45 |
| Industrial Goods | 2.56 |
| Other | 14.85 |
Geographic Allocation
| Name | Percent |
|---|---|
| North America | 71.29 |
| Multi-National | 25.95 |
| Europe | 2.77 |
| Other | -0.01 |
Top Holdings
| Name | Percent |
|---|---|
| Pender Small Cap Opportunities Fund Class A | 37.34 |
| Pender Alternative Select Equity Fund A | 36.72 |
| Pender Alternative Arbitrage Plus Fund Cl A | 25.95 |
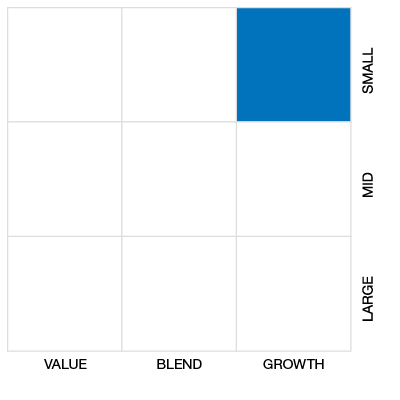
Equity Style
Fixed Income Style

Risk vs Return (3 Yr)
3 Yr Annualized
| Standard Deviation | - | - | - |
|---|---|---|---|
| Beta | - | - | - |
| Alpha | - | - | - |
| Rsquared | - | - | - |
| Sharpe | - | - | - |
| Sortino | - | - | - |
| Treynor | - | - | - |
| Tax Efficiency | - | - | - |
| Volatility | - | - | - |
Risk Rating

Annualized Key Ratio Period Comparison
| Key Ratio | 1 Yr | 3 Yr | 5 Yr | 10 Yr |
|---|---|---|---|---|
| Standard Deviation | - | - | - | - |
| Beta | - | - | - | - |
| Alpha | - | - | - | - |
| Rsquared | - | - | - | - |
| Sharpe | - | - | - | - |
| Sortino | - | - | - | - |
| Treynor | - | - | - | - |
| Tax Efficiency | - | - | - | - |
Fund Details
| Start Date | April 30, 2026 |
|---|---|
| Instrument Type | Mutual Fund (Alternative) |
| Share Class | Fee Based Advice |
| Legal Status | Trust |
| Sales Status | Open |
| Currency | CAD |
| Distribution Frequency | Annual |
| Assets ($mil) | - |
Fund Codes
| FundServ Code | Load Code | Sales Status |
|---|---|---|
| PGF1113 |
Investment Objectives
The Fund’s objective is to achieve long-term capital appreciation by investing primarily in equity and underlying funds with the ability to also invest in debt and other securities; The Fund will gain exposure to equity investments and alternative strategies either directly or indirectly through underlying funds; The Fund is an “alternative mutual fund” within the meaning of NI 81-102, as it is permitted (as modified by exemptive relief received by Pender on behalf of all alternative mutual fund
Investment Strategy
The Fund will invest in a combination of equities and underlying funds that blend alternative investment strategies, equity geographies and investment styles that aim to reduce overall volatility and achieve long-term capital appreciation.46; To achieve the Fund’s investment objectives, the Manager will utilize macroeconomic, technical, and fundamental research to identify attractive risk-adjusted return opportunities within a diversified portfolio; The Fund may carry out all or part of its stra
Portfolio Management
| Portfolio Manager |
PenderFund Capital Management Ltd.
|
|---|---|
| Sub-Advisor |
- |
Management and Organization
| Fund Manager |
PenderFund Capital Management Ltd. |
|---|---|
| Custodian |
CIBC Mellon Trust Company |
| Registrar |
CIBC Mellon Trust Company |
| Distributor |
- |
Investment Minimums
| RSP Eligible | Yes |
|---|---|
| PAC Allowed | No |
| PAC Initial Investment | - |
| PAC Subsequent | - |
| SWP Allowed | No |
| SWP Min Balance | - |
| SWP Min Withdrawal | - |
Fees
| MER | 0.00% |
|---|---|
| Management Fee | 1.10% |
| Load | No Load |
| FE Max | - |
| DSC Max | - |
| Trailer Fee Max (FE) | - |
| Trailer Fee Max (DSC) | - |
| Trailer Fee Max (NL) | - |
| Trailer Fee Max (LL) | - |
Related articles
Try Fund Library Premium
Free with a 30 day trial!
Gain access to
- Unlimited Watchlists
- Advanced Search Filtering
- Fund Comparisons
- Portfolio Scenarios
- Customizable PDF Reports
- Portfolio Rebalancer new
