Try Fund Library Premium
For Free with a 30 day trial!
Natural Resources Equity
 Click for more information on Fundata’s FundGrade
Click for more information on Fundata’s FundGrade.

2020, 2019, 2018, 2017, 2016
Click for more information on Fundata’s FundGrade
|
NAVPS (08-22-2025) |
$17.86 |
|---|---|
| Change |
$0.46
(2.65%)
|
As at July 31, 2025
As at May 31, 2025
Inception Return (November 24, 2011): 5.34%
| Row Heading | Return | Annualized Return | ||||||||||||
|---|---|---|---|---|---|---|---|---|---|---|---|---|---|---|
| 1 Mth | 3 Mth | 6 Mth | YTD | 1 Yr | 2 Yr | 3 Yr | 4 Yr | 5 Yr | 6 Yr | 7 Yr | 8 Yr | 9 Yr | 10 Yr | |
| Fund | -0.13% | 10.62% | 5.35% | 10.67% | 6.68% | 3.98% | 6.98% | 9.48% | 10.75% | 8.56% | 7.25% | 7.38% | 6.14% | 8.87% |
| Benchmark | 1.31% | 7.82% | 10.58% | 16.34% | 16.19% | 15.80% | 12.52% | 13.39% | 12.97% | 11.25% | 8.34% | 8.07% | 6.24% | 7.71% |
| Category Average | 0.28% | 11.36% | 7.39% | 11.32% | 8.54% | 7.52% | 9.27% | 11.77% | 16.32% | 12.35% | 7.47% | 7.77% | 6.26% | 7.20% |
| Category Rank | 98 / 114 | 82 / 114 | 70 / 112 | 71 / 112 | 69 / 111 | 88 / 109 | 88 / 109 | 89 / 104 | 93 / 103 | 91 / 102 | 66 / 101 | 75 / 99 | 66 / 90 | 40 / 82 |
| Quartile Ranking | 4 | 3 | 3 | 3 | 3 | 4 | 4 | 4 | 4 | 4 | 3 | 4 | 3 | 2 |
| Return % | Aug | Sep | Oct | Nov | Dec | Jan | Feb | Mar | Apr | May | Jun | Jul |
|---|---|---|---|---|---|---|---|---|---|---|---|---|
| Fund | -0.79% | -0.11% | 3.71% | 2.27% | -8.30% | 5.04% | -1.56% | 5.60% | -8.38% | 4.25% | 6.24% | -0.13% |
| Benchmark | -0.48% | 0.27% | 4.24% | 0.96% | -4.90% | 5.21% | -0.15% | 5.16% | -2.32% | 3.24% | 3.09% | 1.31% |
23.00% (April 2020)
-25.88% (March 2020)
| Return % | 2015 | 2016 | 2017 | 2018 | 2019 | 2020 | 2021 | 2022 | 2023 | 2024 |
|---|---|---|---|---|---|---|---|---|---|---|
| Fund | -13.48% | 53.64% | 2.34% | -14.91% | 16.64% | 3.30% | 19.00% | 15.28% | -0.36% | 2.72% |
| Benchmark | -23.78% | 36.74% | -1.69% | -15.86% | 20.06% | -7.01% | 21.57% | 12.86% | -0.78% | 19.24% |
| Category Average | -22.23% | 40.92% | -2.18% | -21.77% | 9.95% | 5.03% | 32.84% | 13.19% | 2.62% | 7.76% |
| Quartile Ranking | 1 | 1 | 2 | 2 | 1 | 3 | 4 | 3 | 4 | 4 |
| Category Rank | 18/ 76 | 18/ 85 | 25/ 90 | 41/ 100 | 22/ 102 | 64/ 102 | 94/ 103 | 76/ 105 | 85/ 109 | 98/ 110 |
53.64% (2016)
-14.91% (2018)
| Name | Percent |
|---|---|
| Canadian Equity | 58.02 |
| International Equity | 27.93 |
| US Equity | 12.70 |
| Cash and Equivalents | 0.94 |
| Derivatives | 0.41 |
| Name | Percent |
|---|---|
| Basic Materials | 58.56 |
| Energy | 38.85 |
| Cash and Cash Equivalent | 0.94 |
| Other | 1.65 |
| Name | Percent |
|---|---|
| North America | 72.07 |
| Asia | 22.50 |
| Europe | 5.42 |
| Other | 0.01 |
| Name | Percent |
|---|---|
| WA1 Resources Ltd | 8.73 |
| CanAlaska Uranium Ltd | 7.35 |
| Amarc Resources Ltd | 6.17 |
| Nexgen Energy Ltd | 5.85 |
| Enbridge Inc | 5.75 |
| Spartan Resources Ltd | 5.70 |
| Shell PLC - ADR | 5.42 |
| Williams Cos Inc | 5.15 |
| Canadian Natural Resources Ltd | 5.01 |
| Tourmaline Oil Corp | 4.98 |
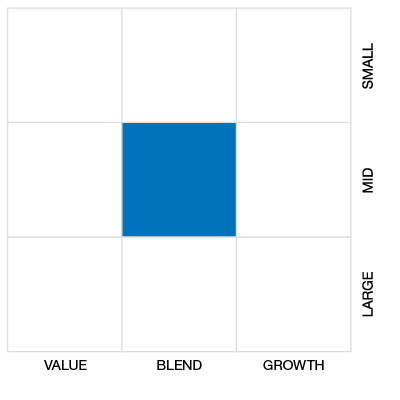

Dynamic Strategic Mining Class Series A
Median
Other - Natural Resources Equity
| Standard Deviation | 15.67% | 17.14% | 19.50% |
|---|---|---|---|
| Beta | 0.83% | 0.90% | 0.93% |
| Alpha | -0.03% | 0.00% | 0.02% |
| Rsquared | 0.65% | 0.71% | 0.76% |
| Sharpe | 0.25% | 0.54% | 0.45% |
| Sortino | 0.45% | 0.75% | 0.57% |
| Treynor | 0.05% | 0.10% | 0.09% |
| Tax Efficiency | 89.71% | 92.61% | 92.18% |
| Volatility |

|

|
|

| Key Ratio | 1 Yr | 3 Yr | 5 Yr | 10 Yr |
|---|---|---|---|---|
| Standard Deviation | 17.16% | 15.67% | 17.14% | 19.50% |
| Beta | 1.51% | 0.83% | 0.90% | 0.93% |
| Alpha | -0.16% | -0.03% | 0.00% | 0.02% |
| Rsquared | 0.87% | 0.65% | 0.71% | 0.76% |
| Sharpe | 0.27% | 0.25% | 0.54% | 0.45% |
| Sortino | 0.39% | 0.45% | 0.75% | 0.57% |
| Treynor | 0.03% | 0.05% | 0.10% | 0.09% |
| Tax Efficiency | 86.53% | 89.71% | 92.61% | 92.18% |
| Start Date | November 24, 2011 |
|---|---|
| Instrument Type | Mutual Fund |
| Share Class | Commission Based Advice |
| Legal Status | Corporation |
| Sales Status | Open |
| Currency | CAD |
| Distribution Frequency | Annual |
| Assets ($mil) | $84 |
| FundServ Code | Load Code | Sales Status |
|---|---|---|
| DYN2660 | ||
| DYN2661 | ||
| DYN2662 | ||
| DYN7186 |
Dynamic Strategic Mining Class seeks to provide long-term capital appreciation by investing primarily in global equity securities of companies involved in the exploration, development and production of physical commodities such as precious metals, base metals, critical minerals, uranium, rare earths and/or ferrous metals.
The Fund will follow a flexible approach to investing in the portfolio with no restrictions on market capitalization, industry sector or geographic mix. Allocations between asset classes and sectors will depend on the portfolio advisor’s economic and market outlook, allowing the Fund to focus on the most attractive investments, which may include, but are not limited to: equity securities of issuers engaged in the exploration, development or production of gold and precious metals, base metals
| Portfolio Manager |
1832 Asset Management L.P.
|
|---|---|
| Sub-Advisor |
- |
| Fund Manager |
1832 Asset Management L.P. |
|---|---|
| Custodian |
State Street Trust Company Canada |
| Registrar |
1832 Asset Management L.P. |
| Distributor |
1832 Asset Management L.P. |
| RSP Eligible | Yes |
|---|---|
| PAC Allowed | Yes |
| PAC Initial Investment | 100 |
| PAC Subsequent | 100 |
| SWP Allowed | Yes |
| SWP Min Balance | 5,000 |
| SWP Min Withdrawal | 100 |
| MER | 2.44% |
|---|---|
| Management Fee | 2.00% |
| Load | Choice of Front or No Load |
| FE Max | 5.00% |
| DSC Max | 6.00% |
| Trailer Fee Max (FE) | 1.00% |
| Trailer Fee Max (DSC) | 1.00% |
| Trailer Fee Max (NL) | - |
| Trailer Fee Max (LL) | - |
Try Fund Library Premium
For Free with a 30 day trial!
 Fund Library