Try Fund Library Premium
Free with a 30 day trial!
Gain access to
- Unlimited Watchlists
- Advanced Search Filtering
- Fund Comparisons
- Portfolio Scenarios
- Customizable PDF Reports
- Portfolio Rebalancer new
Dynamic Strategic Mining Class Series A
Natural Resources Equity
 Click for more information on Fundata’s FundGrade
FundGrade C
Click for more information on Fundata’s FundGrade.

FundGrade A+® Rating Recipient
2020, 2019, 2018, 2017, 2016
Click for more information on Fundata’s FundGrade
|
NAVPS (07-27-2026) |
$21.99 |
|---|---|
| Change |
$0.13
(0.59%)
|
As at June 30, 2026
As at April 30, 2026
Legend
Compare Options
Fund Returns
Inception Return (November 24, 2011): 8.30%
| Row Heading | Return | Annualized Return | ||||||||||||
|---|---|---|---|---|---|---|---|---|---|---|---|---|---|---|
| 1 Mth | 3 Mth | 6 Mth | YTD | 1 Yr | 2 Yr | 3 Yr | 4 Yr | 5 Yr | 6 Yr | 7 Yr | 8 Yr | 9 Yr | 10 Yr | |
| Fund | -6.90% | -2.54% | 6.23% | 6.23% | 56.85% | 27.48% | 21.14% | 20.24% | 17.80% | 18.16% | 14.47% | 12.15% | 12.43% | 10.63% |
| Benchmark | -8.41% | -8.57% | 10.17% | 10.17% | 45.27% | 33.14% | 26.48% | 20.20% | 18.58% | 18.89% | 15.22% | 11.99% | 11.75% | 9.81% |
| Category Average | -7.65% | -5.58% | 10.94% | 10.94% | 44.06% | 27.03% | 20.81% | 18.59% | 16.93% | 21.96% | 16.15% | 11.32% | 11.54% | 9.89% |
| Category Rank | 55 / 118 | 22 / 116 | 106 / 116 | 106 / 116 | 21 / 114 | 66 / 110 | 65 / 109 | 54 / 109 | 61 / 104 | 69 / 102 | 74 / 102 | 54 / 99 | 52 / 97 | 49 / 87 |
| Quartile Ranking | 2 | 1 | 4 | 4 | 1 | 3 | 3 | 2 | 3 | 3 | 3 | 3 | 3 | 3 |
Monthly Return
| Return % | Jul | Aug | Sep | Oct | Nov | Dec | Jan | Feb | Mar | Apr | May | Jun |
|---|---|---|---|---|---|---|---|---|---|---|---|---|
| Fund | -0.13% | 15.10% | 23.73% | -1.62% | -2.06% | 7.73% | 13.59% | 10.33% | -13.03% | 1.59% | 3.04% | -6.90% |
| Benchmark | 1.31% | 9.67% | 11.75% | -2.92% | 9.29% | 0.11% | 9.70% | 15.01% | -4.50% | -1.66% | 1.51% | -8.41% |
Best Monthly Return Since Inception
23.73% (September 2025)
Worst Monthly Return Since Inception
-25.88% (March 2020)
Calendar Return (%)
| Return % | 2016 | 2017 | 2018 | 2019 | 2020 | 2021 | 2022 | 2023 | 2024 | 2025 |
|---|---|---|---|---|---|---|---|---|---|---|
| Fund | 53.64% | 2.34% | -14.91% | 16.64% | 3.30% | 19.00% | 15.28% | -0.36% | 2.72% | 63.60% |
| Benchmark | 36.74% | -1.69% | -15.86% | 20.06% | -7.01% | 21.57% | 12.86% | -0.78% | 19.24% | 51.44% |
| Category Average | 40.92% | -2.18% | -21.77% | 9.95% | 5.03% | 32.84% | 13.19% | 2.62% | 7.76% | 44.14% |
| Quartile Ranking | 1 | 2 | 2 | 1 | 3 | 4 | 3 | 4 | 4 | 1 |
| Category Rank | 15/ 83 | 25/ 88 | 42/ 98 | 22/ 100 | 68/ 102 | 91/ 103 | 75/ 105 | 83/ 109 | 97/ 110 | 26/ 112 |
Best Calendar Return (Last 10 years)
63.60% (2025)
Worst Calendar Return (Last 10 years)
-14.91% (2018)
Asset Allocation
| Name | Percent |
|---|---|
| Canadian Equity | 57.45 |
| International Equity | 39.59 |
| Cash and Equivalents | 2.70 |
| Derivatives | 0.26 |
Sector Allocation
| Name | Percent |
|---|---|
| Basic Materials | 76.68 |
| Financial Services | 3.51 |
| Cash and Cash Equivalent | 2.70 |
| Other | 17.11 |
Geographic Allocation
| Name | Percent |
|---|---|
| North America | 60.41 |
| Asia | 32.10 |
| Europe | 6.68 |
| Latin America | 0.82 |
| Other | -0.01 |
Top Holdings
| Name | Percent |
|---|---|
| Nexgen Energy Ltd | 6.08 |
| Solstice Minerals Ltd | 5.83 |
| Atex Resources Inc | 5.20 |
| Arizona Sonoran Copper Co Inc | 4.24 |
| Ero Copper Corp | 3.93 |
| FireFly Metals Ltd | 3.68 |
| General Accident PLC - Pfd | 3.51 |
| WA1 Resources Ltd | 3.40 |
| Alamos Gold Inc Cl A | 3.34 |
| NGEx Minerals Ltd | 3.32 |
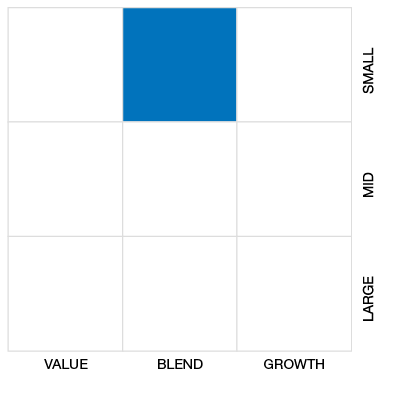
Equity Style
Fixed Income Style

Risk vs Return (3 Yr)
Dynamic Strategic Mining Class Series A
Median
Other - Natural Resources Equity
3 Yr Annualized
| Standard Deviation | 24.40% | 23.02% | 21.71% |
|---|---|---|---|
| Beta | 1.05 | 1.00 | 0.98 |
| Alpha | -0.04 | 0.00 | 0.02 |
| Rsquared | 0.61% | 0.67% | 0.72% |
| Sharpe | 0.76 | 0.70 | 0.49 |
| Sortino | 1.52 | 1.21 | 0.69 |
| Treynor | 0.18 | 0.16 | 0.11 |
| Tax Efficiency | 92.59% | 92.79% | 91.98% |
| Volatility |

|
|
|
Risk Rating

Annualized Key Ratio Period Comparison
| Key Ratio | 1 Yr | 3 Yr | 5 Yr | 10 Yr |
|---|---|---|---|---|
| Standard Deviation | 35.54% | 24.40% | 23.02% | 21.71% |
| Beta | 1.06 | 1.05 | 1.00 | 0.98 |
| Alpha | 0.08 | -0.04 | 0.00 | 0.02 |
| Rsquared | 0.59% | 0.61% | 0.67% | 0.72% |
| Sharpe | 1.38 | 0.76 | 0.70 | 0.49 |
| Sortino | 3.15 | 1.52 | 1.21 | 0.69 |
| Treynor | 0.46 | 0.18 | 0.16 | 0.11 |
| Tax Efficiency | 93.60% | 92.59% | 92.79% | 91.98% |
Fund Details
| Start Date | November 24, 2011 |
|---|---|
| Instrument Type | Mutual Fund |
| Share Class | Commission Based Advice |
| Legal Status | Corporation |
| Sales Status | Open |
| Currency | CAD |
| Distribution Frequency | Annual |
| Assets ($mil) | $197 |
Fund Codes
| FundServ Code | Load Code | Sales Status |
|---|---|---|
| DYN2660 | ||
| DYN2661 | ||
| DYN2662 | ||
| DYN7186 |
Investment Objectives
Dynamic Strategic Mining Class seeks to provide long-term capital appreciation by investing primarily in global equity securities of companies involved in the exploration, development and production of physical commodities such as precious metals, base metals, critical minerals, uranium, rare earths and/or ferrous metals.
Investment Strategy
The Fund will follow a flexible approach to investing in the portfolio with no restrictions on market capitalization, industry sector or geographic mix. Allocations between asset classes and sectors will depend on the portfolio advisor’s economic and market outlook, allowing the Fund to focus on the most attractive investments, which may include, but are not limited to: equity securities of issuers engaged in the exploration, development or production of gold and precious metals, base metals
Portfolio Management
| Portfolio Manager |
1832 Asset Management L.P.
|
|---|---|
| Sub-Advisor |
- |
Management and Organization
| Fund Manager |
1832 Asset Management L.P. |
|---|---|
| Custodian |
State Street Trust Company Canada |
| Registrar |
1832 Asset Management L.P. |
| Distributor |
1832 Asset Management L.P. |
Investment Minimums
| RSP Eligible | Yes |
|---|---|
| PAC Allowed | Yes |
| PAC Initial Investment | 100 |
| PAC Subsequent | 100 |
| SWP Allowed | Yes |
| SWP Min Balance | 5,000 |
| SWP Min Withdrawal | 100 |
Fees
| MER | 2.43% |
|---|---|
| Management Fee | 2.00% |
| Load | Choice of Front or No Load |
| FE Max | 5.00% |
| DSC Max | 6.00% |
| Trailer Fee Max (FE) | 1.00% |
| Trailer Fee Max (DSC) | 1.00% |
| Trailer Fee Max (NL) | - |
| Trailer Fee Max (LL) | - |
Try Fund Library Premium
Free with a 30 day trial!
Gain access to
- Unlimited Watchlists
- Advanced Search Filtering
- Fund Comparisons
- Portfolio Scenarios
- Customizable PDF Reports
- Portfolio Rebalancer new
