Try Fund Library Premium
For Free with a 30 day trial!
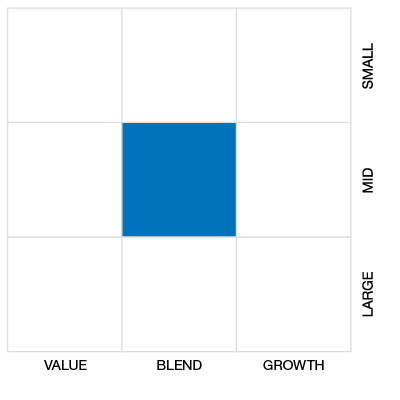
Cdn Foc Small/Mid Cap Eq
 Click for more information on Fundata’s FundGrade
Click for more information on Fundata’s FundGrade.

2024, 2018, 2017, 2016, 2014
Click for more information on Fundata’s FundGrade
|
NAVPS (06-13-2025) |
$37.11 |
|---|---|
| Change |
-$0.19
(-0.50%)
|
As at May 31, 2025
As at May 31, 2025
Inception Return (July 02, 2002): 6.93%
| Row Heading | Return | Annualized Return | ||||||||||||
|---|---|---|---|---|---|---|---|---|---|---|---|---|---|---|
| 1 Mth | 3 Mth | 6 Mth | YTD | 1 Yr | 2 Yr | 3 Yr | 4 Yr | 5 Yr | 6 Yr | 7 Yr | 8 Yr | 9 Yr | 10 Yr | |
| Fund | 5.21% | 2.97% | 5.70% | 8.37% | 17.35% | 18.87% | 12.31% | 11.49% | 19.23% | 12.65% | 8.93% | 7.59% | 9.18% | 8.54% |
| Benchmark | 6.67% | 4.50% | 0.34% | 3.66% | 12.28% | 15.37% | 8.09% | 5.29% | 13.60% | 9.85% | 6.89% | 6.99% | 7.61% | 6.84% |
| Category Average | 5.60% | 0.69% | -3.58% | -0.54% | 12.45% | 11.73% | 7.75% | 3.98% | 11.25% | 9.78% | 8.17% | 8.14% | 8.68% | 7.53% |
| Category Rank | 35 / 48 | 16 / 48 | 3 / 48 | 3 / 48 | 8 / 48 | 8 / 48 | 6 / 48 | 3 / 48 | 5 / 48 | 6 / 45 | 6 / 36 | 12 / 36 | 7 / 34 | 5 / 33 |
| Quartile Ranking | 3 | 2 | 1 | 1 | 1 | 1 | 1 | 1 | 1 | 1 | 1 | 2 | 1 | 1 |
| Return % | Jun | Jul | Aug | Sep | Oct | Nov | Dec | Jan | Feb | Mar | Apr | May |
|---|---|---|---|---|---|---|---|---|---|---|---|---|
| Fund | 0.28% | 5.08% | -0.47% | 0.89% | 1.43% | 3.44% | -2.47% | 3.22% | 1.97% | -1.12% | -1.02% | 5.21% |
| Benchmark | -1.61% | 5.68% | -1.27% | 3.54% | 1.20% | 4.03% | -3.21% | 1.97% | -2.72% | 0.21% | -2.24% | 6.67% |
17.87% (April 2009)
-18.65% (March 2020)
| Return % | 2015 | 2016 | 2017 | 2018 | 2019 | 2020 | 2021 | 2022 | 2023 | 2024 |
|---|---|---|---|---|---|---|---|---|---|---|
| Fund | 2.59% | 21.32% | 7.23% | -11.65% | -0.47% | 9.10% | 33.20% | -2.34% | 13.41% | 16.93% |
| Benchmark | -3.54% | 27.23% | 7.15% | -14.41% | 17.42% | 12.92% | 18.74% | -10.51% | 8.17% | 18.86% |
| Category Average | -2.19% | 16.27% | 9.79% | -11.20% | 21.83% | 30.06% | 13.94% | -13.64% | 7.90% | 18.68% |
| Quartile Ranking | 2 | 2 | 4 | 3 | 4 | 3 | 1 | 1 | 1 | 3 |
| Category Rank | 11/ 31 | 11/ 34 | 28/ 35 | 27/ 36 | 37/ 39 | 30/ 48 | 8/ 48 | 6/ 48 | 4/ 48 | 28/ 48 |
33.20% (2021)
-11.65% (2018)
| Name | Percent |
|---|---|
| Canadian Equity | 59.60 |
| International Equity | 23.88 |
| US Equity | 11.23 |
| Income Trust Units | 4.00 |
| Cash and Equivalents | 1.29 |
| Name | Percent |
|---|---|
| Consumer Goods | 21.59 |
| Industrial Goods | 13.92 |
| Basic Materials | 13.68 |
| Healthcare | 11.75 |
| Technology | 7.49 |
| Other | 31.57 |
| Name | Percent |
|---|---|
| North America | 76.12 |
| Europe | 17.99 |
| Asia | 3.11 |
| Latin America | 2.79 |
| Other | -0.01 |
| Name | Percent |
|---|---|
| Magellan Aerospace Corp | 5.63 |
| Open Text Corp | 4.94 |
| CAE Inc | 4.89 |
| Winpak Ltd | 4.72 |
| Heineken Holding NV | 4.48 |
| Pason Systems Inc | 4.04 |
| Sprott Physical Uranium Trust - Units | 4.00 |
| Nutrien Ltd | 3.97 |
| Lassonde Industries Inc Cl A | 3.88 |
| E-L Financial Corp Ltd | 3.67 |

Brandes Canadian Equity Fund Series A
Median
Other - Cdn Foc Small/Mid Cap Eq
| Standard Deviation | 9.84% | 11.34% | 12.65% |
|---|---|---|---|
| Beta | 0.57% | 0.66% | 0.65% |
| Alpha | 0.07% | 0.09% | 0.04% |
| Rsquared | 0.80% | 0.79% | 0.77% |
| Sharpe | 0.83% | 1.40% | 0.58% |
| Sortino | 1.56% | 2.95% | 0.71% |
| Treynor | 0.14% | 0.24% | 0.11% |
| Tax Efficiency | 95.76% | 97.43% | 96.53% |
| Volatility |

|

|

|

| Key Ratio | 1 Yr | 3 Yr | 5 Yr | 10 Yr |
|---|---|---|---|---|
| Standard Deviation | 8.61% | 9.84% | 11.34% | 12.65% |
| Beta | 0.61% | 0.57% | 0.66% | 0.65% |
| Alpha | 0.09% | 0.07% | 0.09% | 0.04% |
| Rsquared | 0.69% | 0.80% | 0.79% | 0.77% |
| Sharpe | 1.50% | 0.83% | 1.40% | 0.58% |
| Sortino | 3.98% | 1.56% | 2.95% | 0.71% |
| Treynor | 0.21% | 0.14% | 0.24% | 0.11% |
| Tax Efficiency | 100.00% | 95.76% | 97.43% | 96.53% |
| Start Date | July 02, 2002 |
|---|---|
| Instrument Type | Mutual Fund |
| Share Class | Commission Based Advice |
| Legal Status | Trust |
| Sales Status | Open |
| Currency | CAD |
| Distribution Frequency | Annual |
| Assets ($mil) | $75 |
| FundServ Code | Load Code | Sales Status |
|---|---|---|
| BIP121 | ||
| BIP219 | ||
| BIP221 |
The fundamental investment objective of Brandes Canadian Equity Fund is to achieve long-term capital appreciation by investing primarily in the equity securities of Canadian issuers. The Fund may also invest in foreign equity securities.
Brandes LP is a Graham & Dodd value-oriented, global investment adviser that applies fundamental analysis to bottom-up security selection. Brandes LP believes that consistently buying businesses at discounts to conservative estimates of their intrinsic value has the potential to produce competitive long-term results.
| Portfolio Manager |
Brandes Investment Partners & Co. |
|---|---|
| Sub-Advisor |
Brandes Investment Partners L.P.
|
| Fund Manager |
Brandes Investment Partners & Co. |
|---|---|
| Custodian |
State Street Trust Company Canada |
| Registrar |
International Financial Data Services (Canada) Ltd |
| Distributor |
- |
| RSP Eligible | Yes |
|---|---|
| PAC Allowed | Yes |
| PAC Initial Investment | 1,000 |
| PAC Subsequent | 100 |
| SWP Allowed | Yes |
| SWP Min Balance | 10,000 |
| SWP Min Withdrawal | 100 |
| MER | 2.32% |
|---|---|
| Management Fee | 1.85% |
| Load | Choice of Front or No Load |
| FE Max | 5.00% |
| DSC Max | 5.50% |
| Trailer Fee Max (FE) | 1.00% |
| Trailer Fee Max (DSC) | 1.00% |
| Trailer Fee Max (NL) | - |
| Trailer Fee Max (LL) | - |
Try Fund Library Premium
For Free with a 30 day trial!
 Fund Library