Try Fund Library Premium
Free with a 30 day trial!
Gain access to
- Unlimited Watchlists
- Advanced Search Filtering
- Fund Comparisons
- Portfolio Scenarios
- Customizable PDF Reports
- Portfolio Rebalancer new
Brandes Canadian Equity Fund Series A
Cdn Foc Small/Mid Cap Eq
 Click for more information on Fundata’s FundGrade
FundGrade A
Click for more information on Fundata’s FundGrade.
 Click for more information on Fundata’s ESG Grade
Fundata ESG Grade E
Click for more information on Fundata’s ESG Grade.

FundGrade A+® Rating Recipient
2025, 2024, 2018, 2017, 2016
Click for more information on Fundata’s FundGrade
|
NAVPS (07-28-2026) |
$47.08 |
|---|---|
| Change |
$0.80
(1.72%)
|
As at June 30, 2026
As at June 30, 2026
As at June 30, 2026
Legend
Compare Options
Fund Returns
Inception Return (July 02, 2002): 7.61%
| Row Heading | Return | Annualized Return | ||||||||||||
|---|---|---|---|---|---|---|---|---|---|---|---|---|---|---|
| 1 Mth | 3 Mth | 6 Mth | YTD | 1 Yr | 2 Yr | 3 Yr | 4 Yr | 5 Yr | 6 Yr | 7 Yr | 8 Yr | 9 Yr | 10 Yr | |
| Fund | 0.29% | 4.17% | 9.09% | 9.09% | 21.50% | 21.00% | 19.80% | 17.29% | 13.37% | 19.74% | 14.34% | 10.75% | 9.55% | 10.95% |
| Benchmark | -1.16% | 9.56% | 18.80% | 18.80% | 47.72% | 33.26% | 26.72% | 22.10% | 13.54% | 18.90% | 14.84% | 12.04% | 11.63% | 11.39% |
| Category Average | 1.48% | 7.45% | 6.86% | 6.86% | 13.84% | 13.92% | 12.61% | 11.94% | 5.97% | 11.73% | 10.51% | 9.16% | 9.28% | 9.54% |
| Category Rank | 40 / 48 | 45 / 48 | 11 / 48 | 11 / 48 | 12 / 48 | 8 / 48 | 8 / 48 | 9 / 48 | 3 / 48 | 5 / 48 | 7 / 45 | 8 / 38 | 9 / 36 | 7 / 34 |
| Quartile Ranking | 4 | 4 | 1 | 1 | 1 | 1 | 1 | 1 | 1 | 1 | 1 | 1 | 1 | 1 |
Monthly Return
| Return % | Jul | Aug | Sep | Oct | Nov | Dec | Jan | Feb | Mar | Apr | May | Jun |
|---|---|---|---|---|---|---|---|---|---|---|---|---|
| Fund | 0.11% | 1.60% | 3.70% | 2.59% | 1.22% | 1.69% | 3.44% | 6.29% | -4.76% | 0.17% | 3.70% | 0.29% |
| Benchmark | 1.91% | 7.00% | 6.73% | 1.77% | 3.68% | 1.26% | 6.98% | 9.85% | -7.73% | 6.60% | 3.98% | -1.16% |
Best Monthly Return Since Inception
17.87% (April 2009)
Worst Monthly Return Since Inception
-18.65% (March 2020)
Calendar Return (%)
| Return % | 2016 | 2017 | 2018 | 2019 | 2020 | 2021 | 2022 | 2023 | 2024 | 2025 |
|---|---|---|---|---|---|---|---|---|---|---|
| Fund | 21.32% | 7.23% | -11.65% | -0.47% | 9.10% | 33.20% | -2.34% | 13.41% | 16.93% | 24.30% |
| Benchmark | 27.23% | 7.15% | -14.41% | 17.42% | 12.92% | 18.74% | -10.51% | 8.17% | 18.86% | 35.78% |
| Category Average | 16.27% | 9.79% | -11.20% | 21.83% | 30.06% | 13.94% | -13.64% | 7.90% | 18.68% | 9.65% |
| Quartile Ranking | 2 | 4 | 3 | 4 | 3 | 1 | 1 | 1 | 3 | 1 |
| Category Rank | 11/ 34 | 28/ 35 | 27/ 36 | 37/ 39 | 30/ 48 | 8/ 48 | 6/ 48 | 4/ 48 | 28/ 48 | 3/ 48 |
Best Calendar Return (Last 10 years)
33.20% (2021)
Worst Calendar Return (Last 10 years)
-11.65% (2018)
Asset Allocation
| Name | Percent |
|---|---|
| Canadian Equity | 49.72 |
| International Equity | 34.05 |
| US Equity | 11.46 |
| Income Trust Units | 3.72 |
| Cash and Equivalents | 1.05 |
Sector Allocation
| Name | Percent |
|---|---|
| Consumer Goods | 30.61 |
| Basic Materials | 17.63 |
| Industrial Goods | 12.12 |
| Technology | 9.48 |
| Healthcare | 8.43 |
| Other | 21.73 |
Geographic Allocation
| Name | Percent |
|---|---|
| North America | 65.95 |
| Europe | 31.26 |
| Asia | 1.63 |
| Latin America | 1.16 |
Top Holdings
| Name | Percent |
|---|---|
| Winpak Ltd | 5.13 |
| CAE Inc | 4.99 |
| Magellan Aerospace Corp | 4.46 |
| Open Text Corp | 4.43 |
| CCL Industries Inc Cl B | 4.40 |
| Montana Aerospace AG | 4.08 |
| E-L Financial Corp Ltd | 3.94 |
| Sprott Physical Uranium Trust - Units | 3.72 |
| Pason Systems Inc | 3.69 |
| Heineken Holding NV | 3.63 |
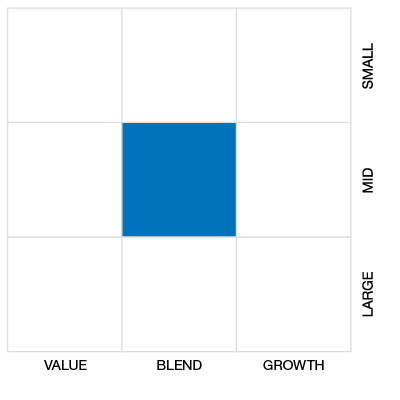
Equity Style
Fixed Income Style

Risk vs Return (3 Yr)
Brandes Canadian Equity Fund Series A
Median
Other - Cdn Foc Small/Mid Cap Eq
3 Yr Annualized
| Standard Deviation | 8.53% | 9.28% | 12.44% |
|---|---|---|---|
| Beta | 0.52 | 0.53 | 0.64 |
| Alpha | 0.06 | 0.06 | 0.03 |
| Rsquared | 0.72% | 0.76% | 0.80% |
| Sharpe | 1.76 | 1.09 | 0.75 |
| Sortino | 3.93 | 1.83 | 1.00 |
| Treynor | 0.29 | 0.19 | 0.15 |
| Tax Efficiency | 99.45% | 97.37% | 97.23% |
| Volatility |

|

|

|
Risk Rating

Annualized Key Ratio Period Comparison
| Key Ratio | 1 Yr | 3 Yr | 5 Yr | 10 Yr |
|---|---|---|---|---|
| Standard Deviation | 9.44% | 8.53% | 9.28% | 12.44% |
| Beta | 0.48 | 0.52 | 0.53 | 0.64 |
| Alpha | 0.00 | 0.06 | 0.06 | 0.03 |
| Rsquared | 0.70% | 0.72% | 0.76% | 0.80% |
| Sharpe | 1.88 | 1.76 | 1.09 | 0.75 |
| Sortino | 3.40 | 3.93 | 1.83 | 1.00 |
| Treynor | 0.37 | 0.29 | 0.19 | 0.15 |
| Tax Efficiency | 98.69% | 99.45% | 97.37% | 97.23% |
Fundata ESG Metrics
Fundata ESG Score
The E, S, and G scores are averaged for each security in the portfolio, to arrive at an ESG score for each security. We take the portfolio weighted average of the ESG scores for each fund and rank them against their peers to arrive at the Fundata ESG Score from 0-100.
Fundata E Score
Three scores under the Environment bucket are averaged to yield the Fundata Environment Score for each fund from 0-100: (1) Pollution Prevention, (2) Environmental Transparency, (3) Resource Efficiency.
Fundata S Score
Six scores under the Social bucket are averaged to yield the Fundata Social Score for each fund from 0-100. (1) Compensation and Satisfaction, (2) Diversity and Rights, (3) Education and Work Conditions, (4) Community and Charity, (5) Human Rights, (6) Sustainability Integration.
Fundata G Score
Three scores under the governance bucket are averaged to yield the Fundata Governance Score for each fund from 0-100: (1) Board Effectiveness, (2) Management Ethics, (3) Disclosure and Accountability.
Powered by OWL Analytics. For more information, please contact Fundata Canada.
Fund Details
| Start Date | July 02, 2002 |
|---|---|
| Instrument Type | Mutual Fund |
| Share Class | Commission Based Advice |
| Legal Status | Trust |
| Sales Status | Open |
| Currency | CAD |
| Distribution Frequency | Annual |
| Assets ($mil) | $132 |
Fund Codes
| FundServ Code | Load Code | Sales Status |
|---|---|---|
| BIP121 | ||
| BIP219 | ||
| BIP221 |
Investment Objectives
The fundamental investment objective of Brandes Canadian Equity Fund is to achieve long-term capital appreciation by investing primarily in the equity securities of Canadian issuers. The Fund may also invest in foreign equity securities.
Investment Strategy
Brandes LP is a Graham & Dodd value-oriented, global investment adviser that applies fundamental analysis to bottom-up security selection. Brandes LP believes that consistently buying businesses at discounts to conservative estimates of their intrinsic value has the potential to produce competitive long-term results.
Portfolio Management
| Portfolio Manager |
Brandes Investment Partners & Co. |
|---|---|
| Sub-Advisor |
Brandes Investment Partners L.P.
|
Management and Organization
| Fund Manager |
Brandes Investment Partners & Co. |
|---|---|
| Custodian |
State Street Trust Company Canada |
| Registrar |
International Financial Data Services (Canada) Ltd |
| Distributor |
- |
Investment Minimums
| RSP Eligible | Yes |
|---|---|
| PAC Allowed | Yes |
| PAC Initial Investment | 1,000 |
| PAC Subsequent | 100 |
| SWP Allowed | Yes |
| SWP Min Balance | 10,000 |
| SWP Min Withdrawal | 100 |
Fees
| MER | 2.31% |
|---|---|
| Management Fee | 1.85% |
| Load | Choice of Front or No Load |
| FE Max | 5.00% |
| DSC Max | 5.50% |
| Trailer Fee Max (FE) | 1.00% |
| Trailer Fee Max (DSC) | 1.00% |
| Trailer Fee Max (NL) | - |
| Trailer Fee Max (LL) | - |
Try Fund Library Premium
Free with a 30 day trial!
Gain access to
- Unlimited Watchlists
- Advanced Search Filtering
- Fund Comparisons
- Portfolio Scenarios
- Customizable PDF Reports
- Portfolio Rebalancer new
