Try Fund Library Premium
For Free with a 30 day trial!
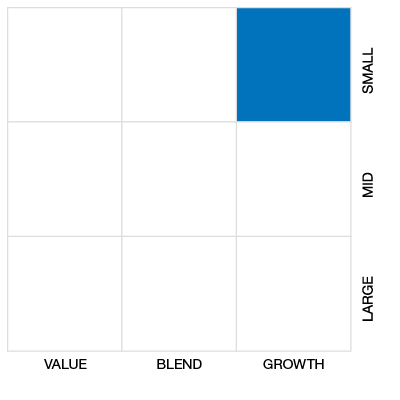
Cdn Small/Mid Cap Equity
 Click for more information on Fundata’s FundGrade
Click for more information on Fundata’s FundGrade.

2024, 2023, 2019, 2018, 2017
Click for more information on Fundata’s FundGrade
|
NAVPS (06-13-2025) |
$39.66 |
|---|---|
| Change |
-$0.14
(-0.34%)
|
As at May 31, 2025
As at April 30, 2025
Inception Return (July 02, 2013): 7.51%
| Row Heading | Return | Annualized Return | ||||||||||||
|---|---|---|---|---|---|---|---|---|---|---|---|---|---|---|
| 1 Mth | 3 Mth | 6 Mth | YTD | 1 Yr | 2 Yr | 3 Yr | 4 Yr | 5 Yr | 6 Yr | 7 Yr | 8 Yr | 9 Yr | 10 Yr | |
| Fund | 7.20% | 7.72% | 2.93% | 5.15% | 18.48% | 13.32% | 10.31% | 8.15% | 15.12% | 9.53% | 7.60% | 7.26% | 7.08% | 6.49% |
| Benchmark | 7.20% | 7.94% | 2.67% | 6.17% | 13.69% | 15.51% | 6.55% | 4.89% | 14.94% | 10.11% | 6.60% | 6.56% | 6.79% | 6.16% |
| Category Average | 7.16% | 5.42% | -0.18% | 2.75% | 14.28% | 12.70% | 7.13% | 5.11% | 12.37% | 8.74% | 6.49% | 6.04% | 6.27% | 5.28% |
| Category Rank | 87 / 139 | 18 / 139 | 12 / 139 | 12 / 139 | 12 / 126 | 30 / 122 | 11 / 122 | 18 / 122 | 22 / 122 | 16 / 118 | 13 / 94 | 13 / 89 | 13 / 89 | 10 / 86 |
| Quartile Ranking | 3 | 1 | 1 | 1 | 1 | 1 | 1 | 1 | 1 | 1 | 1 | 1 | 1 | 1 |
| Return % | Jun | Jul | Aug | Sep | Oct | Nov | Dec | Jan | Feb | Mar | Apr | May |
|---|---|---|---|---|---|---|---|---|---|---|---|---|
| Fund | 4.86% | 5.51% | -0.30% | 1.59% | 0.53% | 2.19% | -2.11% | 0.86% | -3.22% | -0.98% | 1.48% | 7.20% |
| Benchmark | -1.93% | 5.81% | -1.26% | 3.80% | 1.39% | 2.69% | -3.30% | 0.65% | -2.27% | 2.56% | -1.83% | 7.20% |
14.29% (April 2020)
-25.99% (March 2020)
| Return % | 2015 | 2016 | 2017 | 2018 | 2019 | 2020 | 2021 | 2022 | 2023 | 2024 |
|---|---|---|---|---|---|---|---|---|---|---|
| Fund | -7.04% | 22.09% | 1.80% | -12.42% | 15.07% | 0.25% | 24.13% | 0.33% | 9.95% | 13.03% |
| Benchmark | -13.31% | 38.48% | 2.75% | -18.17% | 15.84% | 12.87% | 20.27% | -9.29% | 4.79% | 18.83% |
| Category Average | -6.13% | 18.01% | 3.43% | -15.15% | 16.59% | 11.91% | 22.35% | -11.32% | 6.49% | 16.84% |
| Quartile Ranking | 3 | 1 | 2 | 1 | 3 | 4 | 2 | 1 | 1 | 3 |
| Category Rank | 62/ 85 | 18/ 88 | 41/ 89 | 21/ 89 | 77/ 118 | 105/ 122 | 31/ 122 | 8/ 122 | 30/ 122 | 88/ 126 |
24.13% (2021)
-12.42% (2018)
| Name | Percent |
|---|---|
| Canadian Equity | 96.79 |
| Cash and Equivalents | 1.69 |
| Income Trust Units | 1.16 |
| US Equity | 0.36 |
| Name | Percent |
|---|---|
| Industrial Services | 15.03 |
| Financial Services | 14.70 |
| Energy | 13.93 |
| Consumer Services | 11.65 |
| Basic Materials | 10.69 |
| Other | 34.00 |
| Name | Percent |
|---|---|
| North America | 100.00 |
| Name | Percent |
|---|---|
| IA Clarington Canadian Small Cap Fund Series A | 100.00 |
| Canadian Dollar | 0.00 |

iA Canadian Equity Small Cap (QV) SRP 75/75 & My Education+
Median
Other - Cdn Small/Mid Cap Equity
| Standard Deviation | 11.19% | 11.60% | 14.15% |
|---|---|---|---|
| Beta | 0.54% | 0.55% | 0.61% |
| Alpha | 0.06% | 0.06% | 0.02% |
| Rsquared | 0.61% | 0.65% | 0.74% |
| Sharpe | 0.58% | 1.07% | 0.40% |
| Sortino | 1.19% | 2.02% | 0.42% |
| Treynor | 0.12% | 0.22% | 0.09% |
| Tax Efficiency | 100.00% | 100.00% | 100.00% |
| Volatility |

|

|

|

| Key Ratio | 1 Yr | 3 Yr | 5 Yr | 10 Yr |
|---|---|---|---|---|
| Standard Deviation | 10.77% | 11.19% | 11.60% | 14.15% |
| Beta | 0.62% | 0.54% | 0.55% | 0.61% |
| Alpha | 0.09% | 0.06% | 0.06% | 0.02% |
| Rsquared | 0.45% | 0.61% | 0.65% | 0.74% |
| Sharpe | 1.31% | 0.58% | 1.07% | 0.40% |
| Sortino | 3.31% | 1.19% | 2.02% | 0.42% |
| Treynor | 0.23% | 0.12% | 0.22% | 0.09% |
| Tax Efficiency | 100.00% | 100.00% | 100.00% | 100.00% |
| Start Date | July 02, 2013 |
|---|---|
| Instrument Type | Segregated Fund |
| Share Class | - |
| Legal Status | Trust |
| Sales Status | Open |
| Currency | CAD |
| Distribution Frequency | No Distribution |
| Assets ($mil) | $85 |
| FundServ Code | Load Code | Sales Status |
|---|---|---|
| INA44090 | ||
| INA44091 | ||
| INA44093 | ||
| INA44095 |
Aims to achieve long-term capital appreciation by primarily investing in the stocks of smaller and mid-size Canadian companies.
Invests in units of the IA Clarington Canadian Small Cap Fund. The Fund invests primarily in equities of smaller and mid-size Canadian Companies. The fund may also invest in foreign securities, generally less than 30% of the Fund's book value.
| Portfolio Manager |
QV Investors Inc.
|
|---|---|
| Sub-Advisor |
- |
| Fund Manager |
Industrial Alliance Investment Management Inc. |
|---|---|
| Custodian |
- |
| Registrar |
- |
| Distributor |
- |
| RSP Eligible | Yes |
|---|---|
| PAC Allowed | Yes |
| PAC Initial Investment | 25 |
| PAC Subsequent | 25 |
| SWP Allowed | Yes |
| SWP Min Balance | 10,000 |
| SWP Min Withdrawal | 100 |
| MER | 3.10% |
|---|---|
| Management Fee | 2.55% |
| Load | Choice of Front or No Load |
| FE Max | 5.00% |
| DSC Max | 5.50% |
| Trailer Fee Max (FE) | 0.96% |
| Trailer Fee Max (DSC) | 0.96% |
| Trailer Fee Max (NL) | - |
| Trailer Fee Max (LL) | - |
Try Fund Library Premium
For Free with a 30 day trial!
 Fund Library