Try Fund Library Premium
For Free with a 30 day trial!
Canadian Focused Equity
 Click for more information on Fundata’s FundGrade
Click for more information on Fundata’s FundGrade.
|
NAVPS (10-07-2025) |
$16.46 |
|---|---|
| Change |
-$0.10
(-0.63%)
|
As at August 31, 2025
As at August 31, 2025
Inception Return (March 06, 2014): 7.75%
| Row Heading | Return | Annualized Return | ||||||||||||
|---|---|---|---|---|---|---|---|---|---|---|---|---|---|---|
| 1 Mth | 3 Mth | 6 Mth | YTD | 1 Yr | 2 Yr | 3 Yr | 4 Yr | 5 Yr | 6 Yr | 7 Yr | 8 Yr | 9 Yr | 10 Yr | |
| Fund | 5.67% | 8.50% | 11.98% | 5.49% | 17.89% | 13.17% | 8.48% | 4.76% | 8.72% | 9.20% | 8.07% | 8.39% | 7.89% | 7.32% |
| Benchmark | 3.86% | 9.31% | 11.00% | 14.24% | 22.47% | 20.92% | 17.44% | 10.67% | 13.67% | 12.45% | 10.96% | 11.02% | 10.71% | 10.38% |
| Category Average | 2.33% | 6.61% | 7.37% | 10.09% | 16.15% | 16.70% | 14.44% | 8.72% | 12.30% | 10.89% | 9.28% | 9.28% | 8.96% | 8.57% |
| Category Rank | 5 / 603 | 183 / 600 | 67 / 578 | 530 / 578 | 271 / 578 | 455 / 572 | 563 / 565 | 520 / 554 | 519 / 541 | 441 / 529 | 422 / 504 | 404 / 483 | 350 / 416 | 366 / 405 |
| Quartile Ranking | 1 | 2 | 1 | 4 | 2 | 4 | 4 | 4 | 4 | 4 | 4 | 4 | 4 | 4 |
| Return % | Sep | Oct | Nov | Dec | Jan | Feb | Mar | Apr | May | Jun | Jul | Aug |
|---|---|---|---|---|---|---|---|---|---|---|---|---|
| Fund | 3.89% | 2.75% | 7.67% | -2.76% | -2.01% | -3.86% | -1.05% | -1.94% | 6.37% | 2.81% | -0.12% | 5.67% |
| Benchmark | 2.88% | 0.77% | 5.65% | -2.12% | 3.61% | -0.67% | -2.52% | -1.16% | 5.40% | 3.11% | 2.07% | 3.86% |
11.05% (April 2020)
-11.65% (March 2020)
| Return % | 2015 | 2016 | 2017 | 2018 | 2019 | 2020 | 2021 | 2022 | 2023 | 2024 |
|---|---|---|---|---|---|---|---|---|---|---|
| Fund | 6.94% | 2.55% | 9.20% | -7.04% | 17.76% | 14.73% | 20.48% | -7.89% | 1.82% | 20.63% |
| Benchmark | -0.77% | 14.44% | 10.80% | -7.14% | 21.45% | 7.58% | 21.76% | -8.87% | 13.60% | 22.75% |
| Category Average | -2.47% | 11.42% | 8.06% | -8.78% | 18.54% | 7.73% | 22.26% | -9.42% | 13.34% | 19.16% |
| Quartile Ranking | 1 | 4 | 2 | 2 | 3 | 1 | 4 | 2 | 4 | 2 |
| Category Rank | 48/ 379 | 404/ 412 | 183/ 435 | 236/ 485 | 364/ 517 | 106/ 533 | 442/ 541 | 205/ 554 | 564/ 565 | 266/ 572 |
20.63% (2024)
-7.89% (2022)
| Name | Percent |
|---|---|
| Canadian Equity | 59.51 |
| US Equity | 18.43 |
| Income Trust Units | 8.10 |
| Cash and Equivalents | 5.83 |
| International Equity | 4.37 |
| Other | 3.76 |
| Name | Percent |
|---|---|
| Basic Materials | 20.39 |
| Energy | 17.55 |
| Consumer Services | 13.18 |
| Real Estate | 9.03 |
| Industrial Services | 8.44 |
| Other | 31.41 |
| Name | Percent |
|---|---|
| North America | 90.80 |
| Latin America | 2.44 |
| Europe | 1.96 |
| Asia | 1.51 |
| Multi-National | 1.13 |
| Other | 2.16 |
| Name | Percent |
|---|---|
| Cash and Cash Equivalents | 6.96 |
| Cineplex Inc | 4.95 |
| Enerflex Ltd | 3.73 |
| K-Bro Linen Inc | 3.39 |
| Madison Square Garden Sports Corp Cl A | 3.18 |
| Sprott Physical Uranium Trust - Units | 2.74 |
| California Resources Corp | 2.66 |
| Information Services Corp Cl A | 2.65 |
| RB Global Inc | 2.41 |
| G Mining Ventures Corp | 2.38 |

Exemplar Performance Fund Series A
Median
Other - Canadian Focused Equity
| Standard Deviation | 9.17% | 10.51% | 10.10% |
|---|---|---|---|
| Beta | 0.49% | 0.55% | 0.64% |
| Alpha | 0.00% | 0.01% | 0.01% |
| Rsquared | 0.38% | 0.40% | 0.57% |
| Sharpe | 0.50% | 0.60% | 0.58% |
| Sortino | 1.23% | 1.02% | 0.71% |
| Treynor | 0.09% | 0.12% | 0.09% |
| Tax Efficiency | 91.64% | 69.00% | 80.50% |
| Volatility |

|

|
|

| Key Ratio | 1 Yr | 3 Yr | 5 Yr | 10 Yr |
|---|---|---|---|---|
| Standard Deviation | 13.55% | 9.17% | 10.51% | 10.10% |
| Beta | 1.10% | 0.49% | 0.55% | 0.64% |
| Alpha | -0.06% | 0.00% | 0.01% | 0.01% |
| Rsquared | 0.64% | 0.38% | 0.40% | 0.57% |
| Sharpe | 1.06% | 0.50% | 0.60% | 0.58% |
| Sortino | 2.34% | 1.23% | 1.02% | 0.71% |
| Treynor | 0.13% | 0.09% | 0.12% | 0.09% |
| Tax Efficiency | 87.99% | 91.64% | 69.00% | 80.50% |
| Start Date | March 06, 2014 |
|---|---|
| Instrument Type | Mutual Fund |
| Share Class | Commission Based Advice |
| Legal Status | Trust |
| Sales Status | Open |
| Currency | CAD |
| Distribution Frequency | Annual |
| Assets ($mil) | $9 |
| FundServ Code | Load Code | Sales Status |
|---|---|---|
| AHP1200 |
The investment objective of the Exemplar Performance Fund is to achieve capital appreciation over both short and long term horizons primarily through the selection and management of shares of Canadian equity securities. Unitholder approval (given by a majority of votes cast at a meeting of unitholders) is required prior to a change of investment objectives.
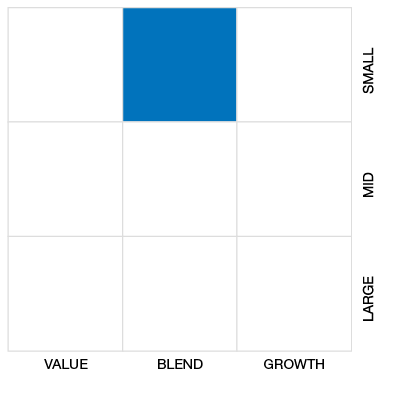
To achieve the investment objectives, the Fund will invest predominantly in large and mid-capitalization Canadian companies. The Fund may invest outside of this investment focus to an extent that will vary from time to time but is not typically expected to exceed 49% of its assets at the time of purchase. The Fund may also invest in bonds and other debt instruments if warranted by financial conditions.
| Portfolio Manager |
Arrow Capital Management Inc.
|
|---|---|
| Sub-Advisor |
- |
| Fund Manager |
Arrow Capital Management Inc. |
|---|---|
| Custodian |
CIBC Mellon Trust Company CIBC World Markets Inc |
| Registrar |
RBC Investor Services Trust (Canada) |
| Distributor |
- |
| RSP Eligible | Yes |
|---|---|
| PAC Allowed | Yes |
| PAC Initial Investment | 1,000 |
| PAC Subsequent | 100 |
| SWP Allowed | Yes |
| SWP Min Balance | 1,000 |
| SWP Min Withdrawal | 100 |
| MER | 2.87% |
|---|---|
| Management Fee | 2.00% |
| Load | Back Fee Only |
| FE Max | 5.00% |
| DSC Max | - |
| Trailer Fee Max (FE) | 1.00% |
| Trailer Fee Max (DSC) | - |
| Trailer Fee Max (NL) | - |
| Trailer Fee Max (LL) | - |
Try Fund Library Premium
For Free with a 30 day trial!
 Fund Library