Try Fund Library Premium
For Free with a 30 day trial!
Alternative Equity Focus
 Click for more information on Fundata’s FundGrade
Click for more information on Fundata’s FundGrade.
 Click for more information on Fundata’s ESG Grade
Click for more information on Fundata’s ESG Grade.

2023
Click for more information on Fundata’s FundGrade
|
NAVPS (10-07-2025) |
$9.02 |
|---|---|
| Change |
-$0.02
(-0.26%)
|
As at August 31, 2025
As at June 30, 2025
As at August 31, 2025
Inception Return (October 16, 2020): 2.76%
| Row Heading | Return | Annualized Return | ||||||||||||
|---|---|---|---|---|---|---|---|---|---|---|---|---|---|---|
| 1 Mth | 3 Mth | 6 Mth | YTD | 1 Yr | 2 Yr | 3 Yr | 4 Yr | 5 Yr | 6 Yr | 7 Yr | 8 Yr | 9 Yr | 10 Yr | |
| Fund | 5.27% | 2.13% | 0.50% | 8.60% | -6.69% | -10.91% | -9.18% | 4.41% | - | - | - | - | - | - |
| Benchmark | 4.96% | 9.85% | 14.09% | 17.59% | 25.86% | 22.26% | 17.49% | 11.88% | 14.98% | 13.03% | 11.75% | 11.54% | 11.06% | 10.82% |
| Category Average | 1.47% | 7.27% | 7.89% | 9.46% | 13.08% | 14.88% | 10.51% | 6.80% | 9.67% | 8.27% | - | - | - | - |
| Category Rank | 20 / 252 | 205 / 243 | 179 / 226 | 90 / 221 | 189 / 194 | 153 / 154 | 137 / 138 | 86 / 119 | - | - | - | - | - | - |
| Quartile Ranking | 1 | 4 | 4 | 2 | 4 | 4 | 4 | 3 | - | - | - | - | - | - |
| Return % | Sep | Oct | Nov | Dec | Jan | Feb | Mar | Apr | May | Jun | Jul | Aug |
|---|---|---|---|---|---|---|---|---|---|---|---|---|
| Fund | 1.69% | -5.15% | -12.97% | 2.36% | -1.72% | 9.95% | 8.07% | -0.12% | -8.84% | -3.06% | 0.07% | 5.27% |
| Benchmark | 3.15% | 0.85% | 6.37% | -3.27% | 3.48% | -0.40% | -1.51% | -0.10% | 5.56% | 2.91% | 1.69% | 4.96% |
18.37% (February 2021)
-25.58% (January 2021)
| Return % | 2015 | 2016 | 2017 | 2018 | 2019 | 2020 | 2021 | 2022 | 2023 | 2024 |
|---|---|---|---|---|---|---|---|---|---|---|
| Fund | - | - | - | - | - | - | 0.29% | 66.10% | -28.84% | -17.47% |
| Benchmark | -8.32% | 21.08% | 9.10% | -8.89% | 22.88% | 5.60% | 25.09% | -5.84% | 11.75% | 21.65% |
| Category Average | - | - | - | - | - | 5.11% | 17.27% | -5.96% | 6.54% | 16.58% |
| Quartile Ranking | - | - | - | - | - | - | 4 | 1 | 4 | 4 |
| Category Rank | - | - | - | - | - | - | 97/ 101 | 6/ 124 | 141/ 142 | 163/ 164 |
66.10% (2022)
-28.84% (2023)
| Name | Percent |
|---|---|
| International Equity | 61.17 |
| Cash and Equivalents | 28.19 |
| Canadian Equity | 7.75 |
| US Equity | 2.83 |
| Foreign Corporate Bonds | 0.06 |
| Name | Percent |
|---|---|
| Consumer Goods | 36.55 |
| Cash and Cash Equivalent | 28.19 |
| Healthcare | 24.05 |
| Industrial Services | 8.37 |
| Consumer Services | 7.29 |
| Name | Percent |
|---|---|
| Europe | 45.34 |
| North America | 38.45 |
| Asia | 11.59 |
| Latin America | 4.62 |
| Name | Percent |
|---|---|
| U.S. DOLLAR | 20.84 |
| Fidelity U.S. Money Market Investment Trust O | 7.29 |
| British American Tobacco PLC | 4.81 |
| Imperial Brands PLC | 4.74 |
| Bayer AG Cl N | 4.69 |
| Diageo PLC | 4.09 |
| Metro Inc | 4.00 |
| Target Corp | 3.66 |
| Pernod Ricard SA | 3.63 |
| Nestle SA Cl N | 3.42 |
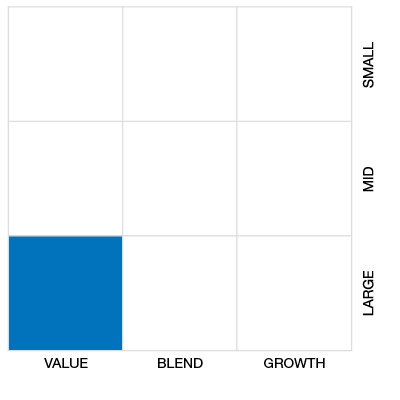

Fidelity Global Value Long/Short Fund Series B
Median
Other - Alternative Equity Focus
| Standard Deviation | 23.18% | - | - |
|---|---|---|---|
| Beta | -0.60% | - | - |
| Alpha | 0.03% | - | - |
| Rsquared | 0.10% | - | - |
| Sharpe | -0.47% | - | - |
| Sortino | -0.52% | - | - |
| Treynor | 0.18% | - | - |
| Tax Efficiency | - | - | - |
| Volatility |

|
- | - |

| Key Ratio | 1 Yr | 3 Yr | 5 Yr | 10 Yr |
|---|---|---|---|---|
| Standard Deviation | 22.97% | 23.18% | - | - |
| Beta | -1.39% | -0.60% | - | - |
| Alpha | 0.29% | 0.03% | - | - |
| Rsquared | 0.39% | 0.10% | - | - |
| Sharpe | -0.33% | -0.47% | - | - |
| Sortino | -0.43% | -0.52% | - | - |
| Treynor | 0.05% | 0.18% | - | - |
| Tax Efficiency | - | - | - | - |
The E, S, and G scores are averaged for each security in the portfolio, to arrive at an ESG score for each security. We take the portfolio weighted average of the ESG scores for each fund and rank them against their peers to arrive at the Fundata ESG Score from 0-100.
Three scores under the Environment bucket are averaged to yield the Fundata Environment Score for each fund from 0-100: (1) Pollution Prevention, (2) Environmental Transparency, (3) Resource Efficiency.
Six scores under the Social bucket are averaged to yield the Fundata Social Score for each fund from 0-100. (1) Compensation and Satisfaction, (2) Diversity and Rights, (3) Education and Work Conditions, (4) Community and Charity, (5) Human Rights, (6) Sustainability Integration.
Three scores under the governance bucket are averaged to yield the Fundata Governance Score for each fund from 0-100: (1) Board Effectiveness, (2) Management Ethics, (3) Disclosure and Accountability.
Powered by OWL Analytics. For more information, please contact Fundata Canada.
| Start Date | October 16, 2020 |
|---|---|
| Instrument Type | Mutual Fund (Alternative) |
| Share Class | Commission Based Advice |
| Legal Status | Trust |
| Sales Status | Open |
| Currency | CAD |
| Distribution Frequency | Annual |
| Assets ($mil) | $1,151 |
| FundServ Code | Load Code | Sales Status |
|---|---|---|
| FID2146 |
The Fund aims to provide long-term capital appreciation by investing primarily in long and short positions of equity securities of companies anywhere in the world. The Fund may use leverage through the use of short selling of up to 50% of its net asset value and by investing in derivatives. The Fund’s gross exposure shall not exceed the limits on the use of leverage or as otherwise permitted under applicable securities legislation and/or regulatory approval.
To meet the Fund’s objectives, the portfolio management team: Uses both long and short equity exposures of primarily developed market equity and credit securities across different countries and regions. Employs a value-oriented investment approach that seeks to identify securities that are trading at discounts (long positions) or premiums (short positions) to the estimates of their intrinsic value.
| Portfolio Manager |
Fidelity Investments Canada ULC
|
|---|---|
| Sub-Advisor |
Fidelity Canada Investment Management |
| Fund Manager |
Fidelity Investments Canada ULC |
|---|---|
| Custodian |
State Street Trust Company Canada |
| Registrar |
Fidelity Investments Canada ULC |
| Distributor |
Fidelity Investments Canada ULC |
| RSP Eligible | Yes |
|---|---|
| PAC Allowed | Yes |
| PAC Initial Investment | 25 |
| PAC Subsequent | 25 |
| SWP Allowed | Yes |
| SWP Min Balance | - |
| SWP Min Withdrawal | - |
| MER | 2.66% |
|---|---|
| Management Fee | 2.15% |
| Load | Back Fee Only |
| FE Max | 5.00% |
| DSC Max | - |
| Trailer Fee Max (FE) | 1.00% |
| Trailer Fee Max (DSC) | - |
| Trailer Fee Max (NL) | - |
| Trailer Fee Max (LL) | - |
Try Fund Library Premium
For Free with a 30 day trial!
 Fund Library