Try Fund Library Premium
For Free with a 30 day trial!
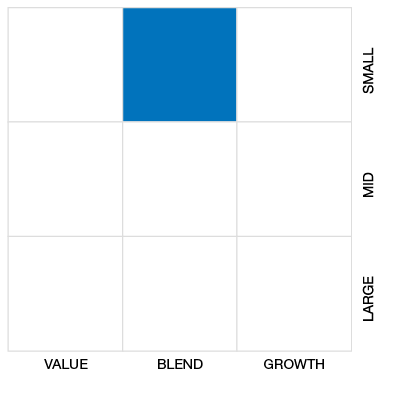
U.S. Small/Mid Cap Equity
 Click for more information on Fundata’s FundGrade
Click for more information on Fundata’s FundGrade.
|
NAVPS (09-17-2025) |
$19.95 |
|---|---|
| Change |
$0.03
(0.16%)
|
As at August 31, 2025
As at August 31, 2025
Inception Return (October 02, 2007): 6.49%
| Row Heading | Return | Annualized Return | ||||||||||||
|---|---|---|---|---|---|---|---|---|---|---|---|---|---|---|
| 1 Mth | 3 Mth | 6 Mth | YTD | 1 Yr | 2 Yr | 3 Yr | 4 Yr | 5 Yr | 6 Yr | 7 Yr | 8 Yr | 9 Yr | 10 Yr | |
| Fund | 9.74% | 14.69% | 3.08% | 1.07% | 6.11% | 8.59% | 6.74% | 0.99% | 8.85% | 7.23% | 4.06% | 5.73% | 5.60% | 5.35% |
| Benchmark | 2.29% | 9.50% | 2.61% | 2.85% | 13.79% | 15.11% | 13.70% | 6.72% | 12.64% | 10.76% | 8.43% | 10.51% | 10.26% | 9.83% |
| Category Average | 3.48% | 8.04% | 2.55% | 0.97% | 4.39% | 9.71% | 8.45% | 2.00% | 8.29% | 6.27% | 4.15% | 5.76% | 6.10% | 6.15% |
| Category Rank | 15 / 295 | 44 / 294 | 122 / 294 | 116 / 293 | 88 / 269 | 134 / 263 | 158 / 257 | 129 / 243 | 97 / 225 | 91 / 196 | 126 / 187 | 120 / 173 | 108 / 159 | 113 / 149 |
| Quartile Ranking | 1 | 1 | 2 | 2 | 2 | 3 | 3 | 3 | 2 | 2 | 3 | 3 | 3 | 4 |
| Return % | Sep | Oct | Nov | Dec | Jan | Feb | Mar | Apr | May | Jun | Jul | Aug |
|---|---|---|---|---|---|---|---|---|---|---|---|---|
| Fund | 0.85% | 0.53% | 9.12% | -5.09% | 3.51% | -5.27% | -5.59% | -7.70% | 3.13% | 3.19% | 1.27% | 9.74% |
| Benchmark | 2.68% | 2.75% | 10.22% | -4.86% | 5.64% | -5.13% | -6.25% | -5.32% | 5.58% | 3.68% | 3.25% | 2.29% |
15.51% (November 2020)
-23.01% (March 2020)
| Return % | 2015 | 2016 | 2017 | 2018 | 2019 | 2020 | 2021 | 2022 | 2023 | 2024 |
|---|---|---|---|---|---|---|---|---|---|---|
| Fund | 2.01% | 13.68% | 7.07% | -12.57% | 15.59% | 11.05% | 25.45% | -18.00% | 8.47% | 11.47% |
| Benchmark | 11.76% | 14.08% | 8.66% | -2.87% | 21.65% | 11.78% | 20.00% | -11.77% | 13.76% | 24.39% |
| Category Average | 6.25% | 9.80% | 10.84% | -7.63% | 15.90% | 4.61% | 23.16% | -17.30% | 11.64% | 13.19% |
| Quartile Ranking | 4 | 2 | 3 | 4 | 4 | 3 | 2 | 3 | 3 | 3 |
| Category Rank | 114/ 138 | 58/ 157 | 116/ 161 | 168/ 181 | 160/ 192 | 105/ 199 | 70/ 243 | 152/ 245 | 161/ 263 | 162/ 267 |
25.45% (2021)
-18.00% (2022)
| Name | Percent |
|---|---|
| US Equity | 91.77 |
| International Equity | 6.80 |
| Canadian Equity | 0.97 |
| Cash and Equivalents | 0.46 |
| Name | Percent |
|---|---|
| Financial Services | 17.05 |
| Healthcare | 15.28 |
| Technology | 12.92 |
| Real Estate | 11.09 |
| Industrial Goods | 9.57 |
| Other | 34.09 |
| Name | Percent |
|---|---|
| North America | 93.20 |
| Latin America | 3.63 |
| Europe | 2.95 |
| Africa and Middle East | 0.22 |
| Name | Percent |
|---|---|
| Resideo Technologies Inc | 1.33 |
| InterDigital Inc | 1.31 |
| Laureate Education Inc | 1.20 |
| Jackson Financial Inc Cl A | 1.18 |
| Coeur Mining Inc | 1.16 |
| EnerSys | 1.15 |
| Foreign Trade Bank Latin America Inc Cl E | 1.11 |
| Belden Inc | 1.10 |
| Phibro Animal Health Corp Cl A | 1.09 |
| Cal-Maine Foods Inc | 1.08 |

U.S. Equity Small Cap Corporate Class Series A
Median
Other - U.S. Small/Mid Cap Equity
| Standard Deviation | 20.24% | 19.37% | 18.88% |
|---|---|---|---|
| Beta | 1.09% | 1.07% | 1.07% |
| Alpha | -0.07% | -0.04% | -0.05% |
| Rsquared | 0.84% | 0.84% | 0.88% |
| Sharpe | 0.22% | 0.40% | 0.28% |
| Sortino | 0.44% | 0.63% | 0.31% |
| Treynor | 0.04% | 0.07% | 0.05% |
| Tax Efficiency | 89.96% | 88.29% | 79.25% |
| Volatility |

|
|
|

| Key Ratio | 1 Yr | 3 Yr | 5 Yr | 10 Yr |
|---|---|---|---|---|
| Standard Deviation | 19.61% | 20.24% | 19.37% | 18.88% |
| Beta | 0.93% | 1.09% | 1.07% | 1.07% |
| Alpha | -0.06% | -0.07% | -0.04% | -0.05% |
| Rsquared | 0.77% | 0.84% | 0.84% | 0.88% |
| Sharpe | 0.24% | 0.22% | 0.40% | 0.28% |
| Sortino | 0.38% | 0.44% | 0.63% | 0.31% |
| Treynor | 0.05% | 0.04% | 0.07% | 0.05% |
| Tax Efficiency | 78.68% | 89.96% | 88.29% | 79.25% |
| Start Date | October 02, 2007 |
|---|---|
| Instrument Type | Mutual Fund |
| Share Class | Commission Based Advice |
| Legal Status | Corporation |
| Sales Status | Open |
| Currency | CAD |
| Distribution Frequency | Quarterly |
| Assets ($mil) | $356 |
| FundServ Code | Load Code | Sales Status |
|---|---|---|
| CIG17570 | ||
| CIG17670 | ||
| CIG17770 | ||
| CIG17870 |
The primary investment objective of the US Equity Small Cap Corporate Class is to obtain maximum long-term capital growth through direct and indirect investments in equity and equity-related securities of small to mid-market capitalization US companies that the portfolio adviser believes have the potential for positive total return. This fund also may invest in other mutual funds.
The portfolio adviser may use techniques such as fundamental analysis to assess the value and growth potential of a company. This means evaluating the financial condition and management of a company, its industry and the overall economy. As part of this evaluation, the portfolio adviser: analyzes financial data and other information sources; assesses the quality of management; conducts company interviews, where possible.
| Portfolio Manager |
CI Global Asset Management |
|---|---|
| Sub-Advisor |
CI Segall Bryant & Hamill Asset Management
|
| Fund Manager |
CI Global Asset Management |
|---|---|
| Custodian |
RBC Investor Services Trust (Canada) |
| Registrar |
CI Global Asset Management |
| Distributor |
Assante Capital Management Ltd. Assante Financial Management Ltd |
| RSP Eligible | Yes |
|---|---|
| PAC Allowed | Yes |
| PAC Initial Investment | 50 |
| PAC Subsequent | 50 |
| SWP Allowed | Yes |
| SWP Min Balance | 5,000 |
| SWP Min Withdrawal | 50 |
| MER | 2.96% |
|---|---|
| Management Fee | 2.50% |
| Load | Choice of Front or No Load |
| FE Max | 4.00% |
| DSC Max | 5.50% |
| Trailer Fee Max (FE) | 1.00% |
| Trailer Fee Max (DSC) | 1.00% |
| Trailer Fee Max (NL) | - |
| Trailer Fee Max (LL) | - |
Try Fund Library Premium
For Free with a 30 day trial!
 Fund Library