Try Fund Library Premium
Free with a 30 day trial!
Gain access to
- Unlimited Watchlists
- Advanced Search Filtering
- Fund Comparisons
- Portfolio Scenarios
- Customizable PDF Reports
- Portfolio Rebalancer new
Fidelity Global Micro-Cap Fund Series B
Global Small/Mid Cap Eq
 Click for more information on Fundata’s FundGrade
FundGrade A
Click for more information on Fundata’s FundGrade.
|
NAVPS (07-29-2026) |
$14.57 |
|---|---|
| Change |
$0.00
(0.01%)
|
As at June 30, 2026
As at March 31, 2026
Legend
Compare Options
Fund Returns
Inception Return (May 22, 2024): 19.98%
| Row Heading | Return | Annualized Return | ||||||||||||
|---|---|---|---|---|---|---|---|---|---|---|---|---|---|---|
| 1 Mth | 3 Mth | 6 Mth | YTD | 1 Yr | 2 Yr | 3 Yr | 4 Yr | 5 Yr | 6 Yr | 7 Yr | 8 Yr | 9 Yr | 10 Yr | |
| Fund | 2.55% | 7.71% | 9.68% | 9.68% | 20.56% | 21.39% | - | - | - | - | - | - | - | - |
| Benchmark | 4.04% | 16.35% | 19.75% | 19.75% | 30.56% | 22.38% | 19.75% | 18.98% | 10.45% | 14.27% | 11.81% | 10.04% | 10.46% | 11.38% |
| Category Average | 3.26% | 12.12% | 11.73% | 11.73% | 18.80% | 15.35% | 13.91% | 13.99% | 6.16% | 10.84% | 8.91% | 7.12% | 7.13% | 7.93% |
| Category Rank | 195 / 261 | 253 / 261 | 171 / 259 | 171 / 259 | 110 / 249 | 55 / 238 | - | - | - | - | - | - | - | - |
| Quartile Ranking | 3 | 4 | 3 | 3 | 2 | 1 | - | - | - | - | - | - | - | - |
Monthly Return
| Return % | Jul | Aug | Sep | Oct | Nov | Dec | Jan | Feb | Mar | Apr | May | Jun |
|---|---|---|---|---|---|---|---|---|---|---|---|---|
| Fund | 1.09% | 5.00% | 2.30% | -1.93% | 2.26% | 0.94% | 3.36% | 4.14% | -5.39% | 2.65% | 2.31% | 2.55% |
| Benchmark | 2.68% | 2.65% | 2.67% | 0.79% | 0.81% | -0.85% | 3.81% | 4.82% | -5.42% | 6.39% | 5.12% | 4.04% |
Best Monthly Return Since Inception
7.74% (July 2024)
Worst Monthly Return Since Inception
-5.39% (March 2026)
Calendar Return (%)
| Return % | 2016 | 2017 | 2018 | 2019 | 2020 | 2021 | 2022 | 2023 | 2024 | 2025 |
|---|---|---|---|---|---|---|---|---|---|---|
| Fund | - | - | - | - | - | - | - | - | - | 22.64% |
| Benchmark | 7.47% | 15.40% | -7.34% | 20.09% | 11.07% | 15.50% | -13.14% | 14.59% | 18.68% | 11.95% |
| Category Average | 3.48% | 12.62% | -10.42% | 13.76% | 14.53% | 12.37% | -15.59% | 12.82% | 12.04% | 12.29% |
| Quartile Ranking | - | - | - | - | - | - | - | - | - | 1 |
| Category Rank | - | - | - | - | - | - | - | - | - | 49/ 240 |
Best Calendar Return (Last 10 years)
22.64% (2025)
Worst Calendar Return (Last 10 years)
22.64% (2025)
Asset Allocation
| Name | Percent |
|---|---|
| International Equity | 72.45 |
| US Equity | 18.99 |
| Cash and Equivalents | 5.23 |
| Canadian Equity | 2.79 |
| Income Trust Units | 0.76 |
| Other | -0.22 |
Sector Allocation
| Name | Percent |
|---|---|
| Consumer Goods | 14.67 |
| Financial Services | 12.77 |
| Industrial Services | 11.62 |
| Industrial Goods | 10.06 |
| Consumer Services | 9.96 |
| Other | 40.92 |
Geographic Allocation
| Name | Percent |
|---|---|
| Asia | 46.04 |
| Europe | 27.24 |
| North America | 22.22 |
| Latin America | 2.16 |
| Africa and Middle East | 0.85 |
| Other | 1.49 |
Top Holdings
| Name | Percent |
|---|---|
| JAPANESE YEN | - |
| EUROPEAN MONETARY UNIT (EURO) | - |
| Amotiv Ltd | - |
| Sabre Insurance Group PLC | - |
| Inaba Denki Sangyo Co Ltd | - |
| Lancashire Holdings Ltd | - |
| Ship Healthcare Holdings Inc | - |
| Systena Corp | - |
| Meisei Industrial Co Ltd | - |
| Toyo Tire Corp | - |
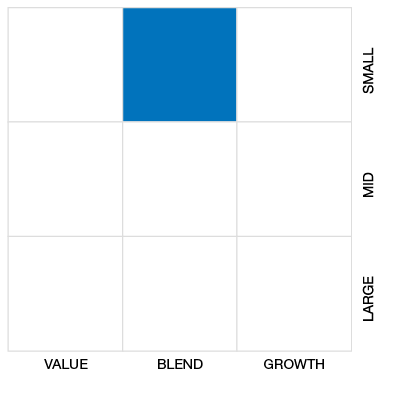
Equity Style
Fixed Income Style

Risk vs Return (3 Yr)
3 Yr Annualized
| Standard Deviation | - | - | - |
|---|---|---|---|
| Beta | - | - | - |
| Alpha | - | - | - |
| Rsquared | - | - | - |
| Sharpe | - | - | - |
| Sortino | - | - | - |
| Treynor | - | - | - |
| Tax Efficiency | - | - | - |
| Volatility | - | - | - |
Risk Rating

Annualized Key Ratio Period Comparison
| Key Ratio | 1 Yr | 3 Yr | 5 Yr | 10 Yr |
|---|---|---|---|---|
| Standard Deviation | 9.73% | - | - | - |
| Beta | 0.71 | - | - | - |
| Alpha | 0.00 | - | - | - |
| Rsquared | 0.65% | - | - | - |
| Sharpe | 1.74 | - | - | - |
| Sortino | 2.69 | - | - | - |
| Treynor | 0.24 | - | - | - |
| Tax Efficiency | 95.28% | - | - | - |
Fund Details
| Start Date | May 22, 2024 |
|---|---|
| Instrument Type | Mutual Fund |
| Share Class | Commission Based Advice |
| Legal Status | Trust |
| Sales Status | Open |
| Currency | CAD |
| Distribution Frequency | Annual |
| Assets ($mil) | $409 |
Fund Codes
| FundServ Code | Load Code | Sales Status |
|---|---|---|
| FID7792 |
Investment Objectives
The Fund aims to achieve long-term capital growth by investing primarily in equity securities of micro and small capitalization companies located anywhere in the world
Investment Strategy
To meet the Fund’s objectives, the portfolio management team: • Uses a combination of fundamental and quantitative approaches to construct a portfolio that aims to identify companies with desirable fundamental characteristics that include, but are not limited to: o Attractive valuation. o High quality profile. o Above-average growth potential. o Diversification across sectors and geographic regions around the world.
Portfolio Management
| Portfolio Manager |
Fidelity Investments Canada ULC
|
|---|---|
| Sub-Advisor |
- |
Management and Organization
| Fund Manager |
Fidelity Investments Canada ULC |
|---|---|
| Custodian |
- |
| Registrar |
- |
| Distributor |
- |
Investment Minimums
| RSP Eligible | Yes |
|---|---|
| PAC Allowed | Yes |
| PAC Initial Investment | 25 |
| PAC Subsequent | 25 |
| SWP Allowed | No |
| SWP Min Balance | - |
| SWP Min Withdrawal | - |
Fees
| MER | 2.18% |
|---|---|
| Management Fee | 1.85% |
| Load | Back Fee Only |
| FE Max | 5.00% |
| DSC Max | - |
| Trailer Fee Max (FE) | 1.00% |
| Trailer Fee Max (DSC) | - |
| Trailer Fee Max (NL) | - |
| Trailer Fee Max (LL) | - |
Try Fund Library Premium
Free with a 30 day trial!
Gain access to
- Unlimited Watchlists
- Advanced Search Filtering
- Fund Comparisons
- Portfolio Scenarios
- Customizable PDF Reports
- Portfolio Rebalancer new
