Try Fund Library Premium
Free with a 30 day trial!
Gain access to
- Unlimited Watchlists
- Advanced Search Filtering
- Fund Comparisons
- Portfolio Scenarios
- Customizable PDF Reports
- Portfolio Rebalancer new
CI Morningstar International Value Hedged Index Fund Series A
International Equity
 Click for more information on Fundata’s ESG Grade
Fundata ESG Grade E
Click for more information on Fundata’s ESG Grade.
|
NAVPS (07-31-2026) |
$10.62 |
|---|---|
| Change |
-$0.09
(-0.86%)
|
As at June 30, 2026
As at April 30, 2026
As at June 30, 2026
No data available
Fund Returns
Inception Return (April 07, 2026): 0.50%
| Row Heading | Return | Annualized Return | ||||||||||||
|---|---|---|---|---|---|---|---|---|---|---|---|---|---|---|
| 1 Mth | 3 Mth | 6 Mth | YTD | 1 Yr | 2 Yr | 3 Yr | 4 Yr | 5 Yr | 6 Yr | 7 Yr | 8 Yr | 9 Yr | 10 Yr | |
| Fund | -1.45% | - | - | - | - | - | - | - | - | - | - | - | - | - |
| Benchmark | 2.50% | 17.58% | 19.46% | 19.46% | 33.58% | 25.23% | 21.66% | 21.46% | 12.54% | 14.17% | 12.00% | 10.28% | 10.14% | 11.21% |
| Category Average | 2.94% | 11.33% | 10.56% | 10.56% | 17.26% | 15.79% | 14.51% | 15.45% | 7.94% | 10.28% | 8.69% | 7.61% | 7.36% | 8.43% |
| Category Rank | 871 / 872 | - | - | - | - | - | - | - | - | - | - | - | - | - |
| Quartile Ranking | 4 | - | - | - | - | - | - | - | - | - | - | - | - | - |
Monthly Return
| Return % | Jul | Aug | Sep | Oct | Nov | Dec | Jan | Feb | Mar | Apr | May | Jun |
|---|---|---|---|---|---|---|---|---|---|---|---|---|
| Fund | - | - | - | - | - | - | - | - | - | - | 2.05% | -1.45% |
| Benchmark | 0.51% | 3.32% | 3.56% | 2.68% | -0.03% | 1.29% | 5.56% | 6.62% | -9.73% | 7.20% | 7.01% | 2.50% |
Best Monthly Return Since Inception
2.05% (May 2026)
Worst Monthly Return Since Inception
-1.45% (June 2026)
Calendar Return (%)
| Return % | 2016 | 2017 | 2018 | 2019 | 2020 | 2021 | 2022 | 2023 | 2024 | 2025 |
|---|---|---|---|---|---|---|---|---|---|---|
| Fund | - | - | - | - | - | - | - | - | - | - |
| Benchmark | -1.70% | 18.37% | -6.81% | 16.27% | 8.01% | 8.97% | -10.67% | 15.74% | 11.18% | 27.50% |
| Category Average | -2.56% | 17.84% | -8.91% | 17.54% | 7.87% | 8.64% | -12.60% | 13.75% | 10.76% | 17.77% |
| Quartile Ranking | - | - | - | - | - | - | - | - | - | - |
| Category Rank | - | - | - | - | - | - | - | - | - | - |
Best Calendar Return (Last 10 years)
-
Worst Calendar Return (Last 10 years)
-
Asset Allocation
| Name | Percent |
|---|---|
| International Equity | 98.42 |
| Cash and Equivalents | 1.06 |
| Income Trust Units | 0.53 |
| Other | -0.01 |
Sector Allocation
| Name | Percent |
|---|---|
| Financial Services | 16.37 |
| Industrial Services | 14.12 |
| Consumer Goods | 13.17 |
| Utilities | 10.42 |
| Consumer Services | 9.47 |
| Other | 36.45 |
Geographic Allocation
| Name | Percent |
|---|---|
| Asia | 49.62 |
| Europe | 48.88 |
| North America | 1.04 |
| Africa and Middle East | 0.44 |
| Other | 0.02 |
Top Holdings
| Name | Percent |
|---|---|
| CI MStar Intl Value Index ETF (VXM) | 99.50 |
| Cash | 1.54 |
| Canadian Dollar | -1.05 |
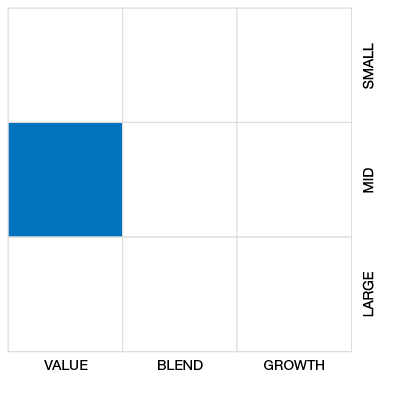
Equity Style
Fixed Income Style

Risk vs Return (3 Yr)
3 Yr Annualized
| Standard Deviation | - | - | - |
|---|---|---|---|
| Beta | - | - | - |
| Alpha | - | - | - |
| Rsquared | - | - | - |
| Sharpe | - | - | - |
| Sortino | - | - | - |
| Treynor | - | - | - |
| Tax Efficiency | - | - | - |
| Volatility | - | - | - |
Risk Rating

Annualized Key Ratio Period Comparison
| Key Ratio | 1 Yr | 3 Yr | 5 Yr | 10 Yr |
|---|---|---|---|---|
| Standard Deviation | - | - | - | - |
| Beta | - | - | - | - |
| Alpha | - | - | - | - |
| Rsquared | - | - | - | - |
| Sharpe | - | - | - | - |
| Sortino | - | - | - | - |
| Treynor | - | - | - | - |
| Tax Efficiency | - | - | - | - |
Fundata ESG Metrics
Fundata ESG Score
The E, S, and G scores are averaged for each security in the portfolio, to arrive at an ESG score for each security. We take the portfolio weighted average of the ESG scores for each fund and rank them against their peers to arrive at the Fundata ESG Score from 0-100.
Fundata E Score
Three scores under the Environment bucket are averaged to yield the Fundata Environment Score for each fund from 0-100: (1) Pollution Prevention, (2) Environmental Transparency, (3) Resource Efficiency.
Fundata S Score
Six scores under the Social bucket are averaged to yield the Fundata Social Score for each fund from 0-100. (1) Compensation and Satisfaction, (2) Diversity and Rights, (3) Education and Work Conditions, (4) Community and Charity, (5) Human Rights, (6) Sustainability Integration.
Fundata G Score
Three scores under the governance bucket are averaged to yield the Fundata Governance Score for each fund from 0-100: (1) Board Effectiveness, (2) Management Ethics, (3) Disclosure and Accountability.
Powered by OWL Analytics. For more information, please contact Fundata Canada.
Fund Details
| Start Date | April 07, 2026 |
|---|---|
| Instrument Type | Mutual Fund |
| Share Class | Commission Based Advice |
| Legal Status | - |
| Sales Status | Open |
| Currency | CAD |
| Distribution Frequency | Quarterly |
| Assets ($mil) | $58 |
Fund Codes
| FundServ Code | Load Code | Sales Status |
|---|---|---|
| CIG2039 | ||
| CIG3239 |
Investment Objectives
The Fund’s investment objective seeks to replicate, to the extent possible, the price and yield performance of the Morningstar® Developed Markets ex-North America Target Value Index™ (the “Index”), net of expenses.
Investment Strategy
To achieve its objective, the fund intends on investing all or substantially all of its assets in Hedged Common Units of CI Morningstar International Value Index ETF (the Underlying ETF ), which has the same portfolio adviser and objectives as the fund. The Underlying ETF seeks to track, to the extent reasonably possible, the price and yield performance of the Index, before fees and expenses. The investment strategy of the Underlying ETF is to invest in and hold the constituent securities of
Portfolio Management
| Portfolio Manager |
CI Global Asset Management
|
|---|---|
| Sub-Advisor |
- |
Management and Organization
| Fund Manager |
CI Global Asset Management |
|---|---|
| Custodian |
CIBC Mellon Trust Company |
| Registrar |
- |
| Distributor |
- |
Investment Minimums
| RSP Eligible | Yes |
|---|---|
| PAC Allowed | Yes |
| PAC Initial Investment | 25 |
| PAC Subsequent | - |
| SWP Allowed | No |
| SWP Min Balance | - |
| SWP Min Withdrawal | - |
Fees
| MER | - |
|---|---|
| Management Fee | 1.55% |
| Load | Choice of Front or No Load |
| FE Max | 5.00% |
| DSC Max | - |
| Trailer Fee Max (FE) | 1.00% |
| Trailer Fee Max (DSC) | 0.50% |
| Trailer Fee Max (NL) | - |
| Trailer Fee Max (LL) | - |
Try Fund Library Premium
Free with a 30 day trial!
Gain access to
- Unlimited Watchlists
- Advanced Search Filtering
- Fund Comparisons
- Portfolio Scenarios
- Customizable PDF Reports
- Portfolio Rebalancer new
