Try Fund Library Premium
For Free with a 30 day trial!
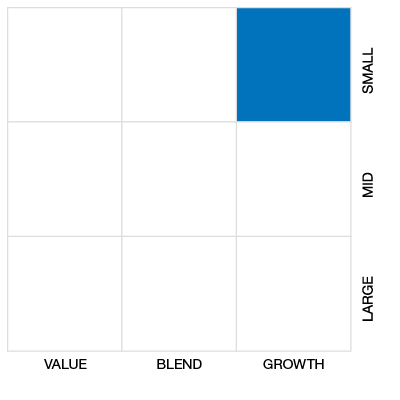
Cdn Small/Mid Cap Equity
 Click for more information on Fundata’s FundGrade
Click for more information on Fundata’s FundGrade.
|
NAVPS (12-12-2025) |
$31.27 |
|---|---|
| Change |
-$0.06
(-0.20%)
|
As at November 30, 2025
As at October 31, 2025
Inception Return (July 04, 2008): 8.35%
| Row Heading | Return | Annualized Return | ||||||||||||
|---|---|---|---|---|---|---|---|---|---|---|---|---|---|---|
| 1 Mth | 3 Mth | 6 Mth | YTD | 1 Yr | 2 Yr | 3 Yr | 4 Yr | 5 Yr | 6 Yr | 7 Yr | 8 Yr | 9 Yr | 10 Yr | |
| Fund | 2.18% | 4.13% | 11.39% | 17.33% | 14.92% | 18.24% | 13.51% | 11.23% | 13.76% | 11.02% | 10.46% | 8.32% | 7.79% | 8.37% |
| Benchmark | 5.23% | 17.24% | 38.15% | 46.68% | 41.85% | 34.48% | 21.49% | 13.80% | 16.09% | 15.47% | 14.07% | 10.28% | 9.57% | 11.56% |
| Category Average | 2.20% | 7.45% | 18.13% | 21.37% | 17.92% | 21.66% | 13.92% | 8.43% | 11.45% | 11.00% | 10.70% | 7.94% | 7.49% | 8.07% |
| Category Rank | 95 / 198 | 147 / 197 | 152 / 197 | 145 / 196 | 142 / 196 | 149 / 193 | 108 / 192 | 61 / 190 | 57 / 182 | 100 / 175 | 108 / 166 | 96 / 163 | 93 / 154 | 79 / 133 |
| Quartile Ranking | 2 | 3 | 4 | 3 | 3 | 4 | 3 | 2 | 2 | 3 | 3 | 3 | 3 | 3 |
| Return % | Dec | Jan | Feb | Mar | Apr | May | Jun | Jul | Aug | Sep | Oct | Nov |
|---|---|---|---|---|---|---|---|---|---|---|---|---|
| Fund | -2.05% | 0.89% | -3.16% | -0.94% | 1.51% | 7.22% | 3.78% | -1.42% | 4.56% | 1.45% | 0.45% | 2.18% |
| Benchmark | -3.30% | 0.65% | -2.27% | 2.56% | -1.83% | 7.20% | 6.19% | 1.50% | 9.34% | 8.91% | 2.30% | 5.23% |
14.11% (April 2020)
-25.70% (March 2020)
| Return % | 2015 | 2016 | 2017 | 2018 | 2019 | 2020 | 2021 | 2022 | 2023 | 2024 |
|---|---|---|---|---|---|---|---|---|---|---|
| Fund | -6.82% | 21.95% | 1.80% | -12.29% | 15.14% | 0.23% | 23.99% | 0.80% | 10.43% | 13.44% |
| Benchmark | -13.31% | 38.48% | 2.75% | -18.17% | 15.84% | 12.87% | 20.27% | -9.29% | 4.79% | 18.83% |
| Category Average | -6.13% | 18.01% | 3.43% | -15.15% | 16.59% | 11.91% | 22.35% | -11.32% | 6.49% | 16.84% |
| Quartile Ranking | 3 | 2 | 3 | 2 | 4 | 4 | 2 | 1 | 2 | 4 |
| Category Rank | 94/ 127 | 53/ 149 | 96/ 154 | 52/ 163 | 145/ 170 | 168/ 175 | 78/ 182 | 18/ 190 | 59/ 192 | 173/ 193 |
23.99% (2021)
-12.29% (2018)
| Name | Percent |
|---|---|
| Canadian Equity | 96.20 |
| Cash and Equivalents | 2.34 |
| Income Trust Units | 1.11 |
| US Equity | 0.36 |
| Name | Percent |
|---|---|
| Financial Services | 15.00 |
| Industrial Services | 14.57 |
| Energy | 14.01 |
| Consumer Services | 13.77 |
| Basic Materials | 10.69 |
| Other | 31.96 |
| Name | Percent |
|---|---|
| North America | 100.00 |
| Name | Percent |
|---|---|
| Pet Valu Holdings Ltd | 4.98 |
| Parkland Fuel Corp | 4.66 |
| Aritzia Inc | 4.58 |
| Mullen Group Ltd | 4.37 |
| Winpak Ltd | 4.32 |
| Information Services Corp Cl A | 4.30 |
| Lassonde Industries Inc Cl A | 4.15 |
| AltaGas Ltd | 4.02 |
| E-L Financial Corp Ltd | 3.89 |
| iA Financial Corp Inc | 3.58 |

IA Clarington QV Canadian Small Cap Class Series A
Median
Other - Cdn Small/Mid Cap Equity
| Standard Deviation | 8.95% | 10.52% | 13.97% |
|---|---|---|---|
| Beta | 0.41% | 0.50% | 0.60% |
| Alpha | 0.05% | 0.05% | 0.01% |
| Rsquared | 0.40% | 0.55% | 0.73% |
| Sharpe | 1.03% | 1.03% | 0.52% |
| Sortino | 2.47% | 1.84% | 0.60% |
| Treynor | 0.23% | 0.22% | 0.12% |
| Tax Efficiency | 91.15% | 90.97% | 85.63% |
| Volatility |

|

|

|

| Key Ratio | 1 Yr | 3 Yr | 5 Yr | 10 Yr |
|---|---|---|---|---|
| Standard Deviation | 10.29% | 8.95% | 10.52% | 13.97% |
| Beta | 0.51% | 0.41% | 0.50% | 0.60% |
| Alpha | -0.04% | 0.05% | 0.05% | 0.01% |
| Rsquared | 0.57% | 0.40% | 0.55% | 0.73% |
| Sharpe | 1.14% | 1.03% | 1.03% | 0.52% |
| Sortino | 2.49% | 2.47% | 1.84% | 0.60% |
| Treynor | 0.23% | 0.23% | 0.22% | 0.12% |
| Tax Efficiency | 89.29% | 91.15% | 90.97% | 85.63% |
| Start Date | July 04, 2008 |
|---|---|
| Instrument Type | Mutual Fund |
| Share Class | Commission Based Advice |
| Legal Status | Corporation |
| Sales Status | Open |
| Currency | CAD |
| Distribution Frequency | Annual |
| Assets ($mil) | - |
| FundServ Code | Load Code | Sales Status |
|---|---|---|
| CCM8078 | ||
| CCM8088 | ||
| CCM8089 |
The Fund’s objective is to maximize long-term growth of capital by investing primarily in equity securities of small capitalization Canadian companies. It may invest in those securities either directly or by investing in securities of another mutual fund that invests in those securities.
The Fund invests substantially all of its assets in units of IA Clarington Canadian Small Cap Fund, which we refer to as the “ Reference Fund”. The Fund: will hold cash or cash equivalents only while the investment in units of the Reference Fund is pending or in order to facilitate redemptions.
| Portfolio Manager |
Industrial Alliance Investment Management Inc. |
|---|---|
| Sub-Advisor |
QV Investors Inc.
|
| Fund Manager |
IA Clarington Investments Inc. |
|---|---|
| Custodian |
CIBC Mellon Trust Company |
| Registrar |
IA Clarington Investments Inc. |
| Distributor |
- |
| RSP Eligible | Yes |
|---|---|
| PAC Allowed | Yes |
| PAC Initial Investment | 500 |
| PAC Subsequent | 50 |
| SWP Allowed | Yes |
| SWP Min Balance | 500 |
| SWP Min Withdrawal | 100 |
| MER | 2.59% |
|---|---|
| Management Fee | 2.10% |
| Load | Choice of Front or No Load |
| FE Max | 5.00% |
| DSC Max | 5.75% |
| Trailer Fee Max (FE) | 1.00% |
| Trailer Fee Max (DSC) | 1.00% |
| Trailer Fee Max (NL) | - |
| Trailer Fee Max (LL) | - |
Try Fund Library Premium
For Free with a 30 day trial!
 Fund Library