Try Fund Library Premium
Free with a 30 day trial!
Gain access to
- Unlimited Watchlists
- Advanced Search Filtering
- Fund Comparisons
- Portfolio Scenarios
- Customizable PDF Reports
- Portfolio Rebalancer new
Ninepoint Enhanced Aerospace and Defense HighShares ETF (EDHI : TSX)
Alternative Equity Focus
|
Close (11-10-2026) |
$10.26 |
|---|---|
| Change |
$0.21
(2.09%)
|
| Open | $10.04 |
|---|---|
| Day Range | $10.04 - $10.21 |
| Volume | 2,812 |
As at October 31, 2026
As at October 31, 2026
No data available
Fund Returns
Inception Return (September 14, 2026): -
| Row Heading | Return | Annualized Return | ||||||||||||
|---|---|---|---|---|---|---|---|---|---|---|---|---|---|---|
| 1 Mth | 3 Mth | 6 Mth | YTD | 1 Yr | 2 Yr | 3 Yr | 4 Yr | 5 Yr | 6 Yr | 7 Yr | 8 Yr | 9 Yr | 10 Yr | |
| Fund | - | - | - | - | - | - | - | - | - | - | - | - | - | - |
| Benchmark | 1.24% | 1.64% | 6.00% | 14.37% | 20.35% | 24.48% | 26.95% | 19.73% | 14.34% | 18.09% | 14.94% | 14.72% | 12.55% | 12.44% |
| Category Average | -0.89% | 3.76% | 3.76% | 10.20% | 11.36% | 13.34% | 16.73% | 11.57% | 8.65% | 11.13% | 9.38% | - | - | - |
| Category Rank | - | - | - | - | - | - | - | - | - | - | - | - | - | - |
| Quartile Ranking | - | - | - | - | - | - | - | - | - | - | - | - | - | - |
Monthly Return
| Return % | Nov | Dec | Jan | Feb | Mar | Apr | May | Jun | Jul | Aug | Sep | Oct |
|---|---|---|---|---|---|---|---|---|---|---|---|---|
| Fund | - | - | - | - | - | - | - | - | - | - | - | - |
| Benchmark | 3.86% | 1.32% | 0.84% | 7.72% | -4.32% | 3.81% | 2.52% | 0.50% | 1.22% | 3.10% | -2.62% | 1.24% |
Best Monthly Return Since Inception
-
Worst Monthly Return Since Inception
-
Calendar Return (%)
| Return % | 2016 | 2017 | 2018 | 2019 | 2020 | 2021 | 2022 | 2023 | 2024 | 2025 |
|---|---|---|---|---|---|---|---|---|---|---|
| Fund | - | - | - | - | - | - | - | - | - | - |
| Benchmark | 21.08% | 9.10% | -8.89% | 22.88% | 5.60% | 25.09% | -5.84% | 11.75% | 21.65% | 31.68% |
| Category Average | - | - | - | - | 5.11% | 17.27% | -5.96% | 6.54% | 16.58% | 15.40% |
| Quartile Ranking | - | - | - | - | - | - | - | - | - | - |
| Category Rank | - | - | - | - | - | - | - | - | - | - |
Best Calendar Return (Last 10 years)
-
Worst Calendar Return (Last 10 years)
-
Asset Allocation
| Name | Percent |
|---|---|
| US Equity | 113.50 |
| Cash and Equivalents | -13.51 |
| Other | 0.01 |
Sector Allocation
| Name | Percent |
|---|---|
| Industrial Goods | 98.92 |
| Exchange Traded Fund | 16.63 |
| Cash and Cash Equivalent | -13.50 |
| Other | -2.05 |
Geographic Allocation
| Name | Percent |
|---|---|
| North America | 100.00 |
Top Holdings
| Name | Percent |
|---|---|
| Lockheed Martin Corp | 12.11 |
| L3harris Technologies Inc | 11.90 |
| General Dynamics Corp | 11.45 |
| Northrop Grumman Corp | 11.41 |
| Rocket Lab Corp | 11.10 |
| Raytheon Technologies Corp | 10.84 |
| TransDigm Group Inc | 10.59 |
| General Electric Co | 10.13 |
| Boeing Co | 9.40 |
| Ninepoint Palantir HighShares ETF | 8.54 |
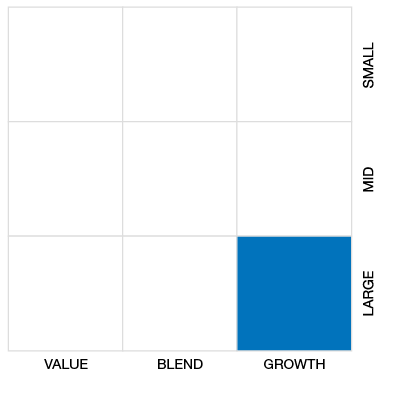
Equity Style
Fixed Income Style

Risk vs Return (3 Yr)
3 Yr Annualized
| Standard Deviation | - | - | - |
|---|---|---|---|
| Beta | - | - | - |
| Alpha | - | - | - |
| Rsquared | - | - | - |
| Sharpe | - | - | - |
| Sortino | - | - | - |
| Treynor | - | - | - |
| Tax Efficiency | - | - | - |
| Volatility | - | - | - |
Risk Rating

Annualized Key Ratio Period Comparison
| Key Ratio | 1 Yr | 3 Yr | 5 Yr | 10 Yr |
|---|---|---|---|---|
| Standard Deviation | - | - | - | - |
| Beta | - | - | - | - |
| Alpha | - | - | - | - |
| Rsquared | - | - | - | - |
| Sharpe | - | - | - | - |
| Sortino | - | - | - | - |
| Treynor | - | - | - | - |
| Tax Efficiency | - | - | - | - |
Fund Details
| Start Date | September 14, 2026 |
|---|---|
| Instrument Type | Exchange Traded Fund (Alternative) |
| Share Class | Do-It-Yourself |
| Legal Status | - |
| Sales Status | Open |
| Currency | CAD |
| Distribution Frequency | - |
| Assets ($mil) | $5 |
| 52 Week High | $10.37 |
| 52 Week Low | $9.28 |
| Annual Dividend | $0.20 |
| Annual Yield | - |
| Index | - |
| Shares Outstanding | - |
| Registered Plan Eligible | Yes |
ETF Characteristics
| Exposure | - |
|---|---|
| Asset Class High | - |
| Asset Class Medium | - |
| Asset Class Low | - |
| Leveraged | - |
| Inverse | - |
| Advisor Series | - |
| Covered Call Strategy | No |
Investment Objectives
The ETF seeks to provide unitholders with regular cash distributions and the opportunity for capital appreciation by investing primarily, directly or indirectly, in equity securities of global defense and aerospace issuers, while employing a covered call option writing strategy and the use of leverage. As an alternative mutual fund (as defined in NI 81-102), the ETF may employ leverage through cash borrowing.
Investment Strategy
To achieve the ETF's investment objectives, the ETF invests primarily in equity securities of global defense and security-related issuers. The ETF may invest directly in such equity securities or indirectly through investments in other investment funds (which may include exchange-traded funds) and in ADRs when a direct investment in the local equity market is not accessible or deemed inefficient.
Portfolio Management
| Portfolio Manager |
Ninepoint Partners LP
|
|---|---|
| Sub-Advisor |
- |
Management and Organization
| Fund Manager |
Ninepoint Partners LP |
|---|---|
| Custodian |
- |
| Registrar |
- |
| Distributor |
- |
Fees
| MER | - |
|---|---|
| Management Fee | - |
Try Fund Library Premium
Free with a 30 day trial!
Gain access to
- Unlimited Watchlists
- Advanced Search Filtering
- Fund Comparisons
- Portfolio Scenarios
- Customizable PDF Reports
- Portfolio Rebalancer new