Try Fund Library Premium
Free with a 30 day trial!
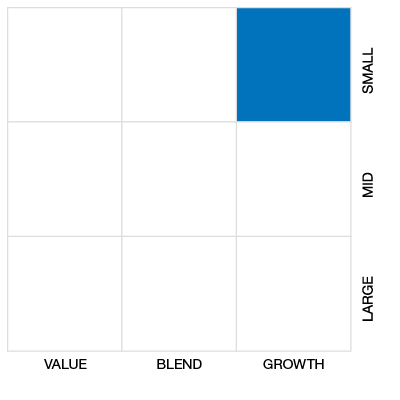
Cdn Small/Mid Cap Equity
 Click for more information on Fundata’s FundGrade
Click for more information on Fundata’s FundGrade.
|
NAVPS (06-16-2026) |
$73.18 |
|---|---|
| Change |
-$0.67
(-0.90%)
|
As at May 31, 2026
As at May 31, 2026
Inception Return (February 25, 1988): 8.37%
| Row Heading | Return | Annualized Return | ||||||||||||
|---|---|---|---|---|---|---|---|---|---|---|---|---|---|---|
| 1 Mth | 3 Mth | 6 Mth | YTD | 1 Yr | 2 Yr | 3 Yr | 4 Yr | 5 Yr | 6 Yr | 7 Yr | 8 Yr | 9 Yr | 10 Yr | |
| Fund | 0.65% | -3.35% | 3.37% | 1.50% | 8.48% | 6.62% | 9.20% | 5.26% | 3.79% | 9.02% | 6.78% | 4.80% | 4.10% | 3.91% |
| Benchmark | 3.36% | 0.40% | 25.77% | 22.83% | 73.76% | 40.55% | 32.35% | 20.41% | 16.03% | 23.14% | 17.52% | 13.32% | 12.51% | 12.12% |
| Category Average | 2.79% | -1.67% | 13.67% | 10.77% | 34.27% | 23.87% | 19.47% | 13.35% | 10.39% | 15.76% | 12.06% | 9.62% | 8.86% | 8.78% |
| Category Rank | 161 / 196 | 116 / 195 | 184 / 193 | 185 / 194 | 186 / 192 | 190 / 191 | 186 / 187 | 184 / 184 | 176 / 177 | 166 / 169 | 166 / 167 | 159 / 159 | 157 / 157 | 147 / 147 |
| Quartile Ranking | 4 | 3 | 4 | 4 | 4 | 4 | 4 | 4 | 4 | 4 | 4 | 4 | 4 | 4 |
| Return % | Jun | Jul | Aug | Sep | Oct | Nov | Dec | Jan | Feb | Mar | Apr | May |
|---|---|---|---|---|---|---|---|---|---|---|---|---|
| Fund | 4.54% | 1.74% | 2.40% | -0.98% | -0.28% | -2.43% | 1.84% | 1.40% | 3.57% | -7.07% | 3.34% | 0.65% |
| Benchmark | 6.19% | 1.50% | 9.34% | 8.91% | 2.30% | 5.23% | 2.39% | 8.69% | 12.56% | -8.97% | 6.71% | 3.36% |
20.16% (April 2020)
-24.83% (March 2020)
| Return % | 2016 | 2017 | 2018 | 2019 | 2020 | 2021 | 2022 | 2023 | 2024 | 2025 |
|---|---|---|---|---|---|---|---|---|---|---|
| Fund | 18.10% | -4.30% | -20.72% | 17.92% | 12.66% | 20.57% | -16.25% | 10.20% | 15.46% | 2.13% |
| Benchmark | 38.48% | 2.75% | -18.17% | 15.84% | 12.87% | 20.27% | -9.29% | 4.79% | 18.83% | 50.19% |
| Category Average | 18.01% | 3.43% | -15.15% | 16.59% | 11.91% | 22.35% | -11.32% | 6.49% | 16.84% | 24.55% |
| Quartile Ranking | 3 | 4 | 4 | 3 | 3 | 3 | 3 | 2 | 3 | 4 |
| Category Rank | 94/ 144 | 149/ 149 | 148/ 158 | 92/ 165 | 110/ 169 | 117/ 176 | 127/ 184 | 62/ 187 | 127/ 188 | 188/ 191 |
20.57% (2021)
-20.72% (2018)
| Name | Percent |
|---|---|
| Canadian Equity | 88.31 |
| US Equity | 7.06 |
| International Equity | 2.17 |
| Cash and Equivalents | 1.44 |
| Income Trust Units | 1.02 |
| Name | Percent |
|---|---|
| Real Estate | 22.21 |
| Energy | 18.89 |
| Industrial Goods | 18.87 |
| Consumer Goods | 8.88 |
| Technology | 8.01 |
| Other | 23.14 |
| Name | Percent |
|---|---|
| North America | 97.83 |
| Asia | 2.17 |
| Name | Percent |
|---|---|
| Black Diamond Group Ltd | 5.81 |
| Mainstreet Equity Corp | 4.80 |
| TerraVest Industries Inc | 4.50 |
| Richelieu Hardware Ltd | 4.46 |
| Topaz Energy Corp | 4.40 |
| Savaria Corp | 4.10 |
| FirstService Corp | 4.05 |
| ADENTRA Inc | 3.62 |
| Firan Technology Group Corp | 3.56 |
| Kelt Exploration Ltd | 3.48 |

NBI Small Cap Fund Investor Series
Median
Other - Cdn Small/Mid Cap Equity
| Standard Deviation | 11.92% | 13.18% | 15.90% |
|---|---|---|---|
| Beta | 0.47 | 0.54 | 0.67 |
| Alpha | -0.04 | -0.04 | -0.04 |
| Rsquared | 0.39% | 0.49% | 0.72% |
| Sharpe | 0.50 | 0.13 | 0.20 |
| Sortino | 0.88 | 0.17 | 0.18 |
| Treynor | 0.13 | 0.03 | 0.05 |
| Tax Efficiency | 100.00% | 99.86% | 99.82% |
| Volatility |

|
|

|

| Key Ratio | 1 Yr | 3 Yr | 5 Yr | 10 Yr |
|---|---|---|---|---|
| Standard Deviation | 10.94% | 11.92% | 13.18% | 15.90% |
| Beta | 0.41 | 0.47 | 0.54 | 0.67 |
| Alpha | -0.15 | -0.04 | -0.04 | -0.04 |
| Rsquared | 0.52% | 0.39% | 0.49% | 0.72% |
| Sharpe | 0.58 | 0.50 | 0.13 | 0.20 |
| Sortino | 0.72 | 0.88 | 0.17 | 0.18 |
| Treynor | 0.15 | 0.13 | 0.03 | 0.05 |
| Tax Efficiency | 100.00% | 100.00% | 99.86% | 99.82% |
| Start Date | February 25, 1988 |
|---|---|
| Instrument Type | Mutual Fund |
| Share Class | Commission Based Advice |
| Legal Status | Trust |
| Sales Status | Open |
| Currency | CAD |
| Distribution Frequency | Annual |
| Assets ($mil) | $77 |
| FundServ Code | Load Code | Sales Status |
|---|---|---|
| NBC841 |
The NBI Small Cap Fund’s investment objective is to provide long-term capital growth and preservation. The fund invests primarily in common shares of companies chosen for their growth potential. The fund may also invest in money market instruments and securities of Canadian federal and provincial governments. The fund makes investments in small capitalization companies which provide you with additional dynamic growth potential for a diversified portfolio.
The fund invests mainly in small capitalization Canadian equities. The fund may also invest in: equity securities of Canadian mid and large capitalization companies; rights and warrants; equity securities of foreign companies. The portfolio sub-advisor may choose to invest approximately 45% of the net assets of the fund in securities of underlying mutual funds managed by the manager or by third parties, including exchange-traded funds.
| Portfolio Manager |
National Bank Trust Inc. |
|---|---|
| Sub-Advisor |
Montrusco Bolton Investments Inc. |
| Fund Manager |
National Bank Investments Inc. |
|---|---|
| Custodian |
Natcan Trust Company |
| Registrar |
Natcan Trust Company |
| Distributor |
National Bank Investments Inc. |
| RSP Eligible | Yes |
|---|---|
| PAC Allowed | Yes |
| PAC Initial Investment | 25 |
| PAC Subsequent | 25 |
| SWP Allowed | Yes |
| SWP Min Balance | 10,000 |
| SWP Min Withdrawal | 50 |
| MER | 2.19% |
|---|---|
| Management Fee | 1.75% |
| Load | No Load |
| FE Max | - |
| DSC Max | - |
| Trailer Fee Max (FE) | - |
| Trailer Fee Max (DSC) | - |
| Trailer Fee Max (NL) | 1.00% |
| Trailer Fee Max (LL) | - |
Try Fund Library Premium
Free with a 30 day trial!
 Fund Library