Try Fund Library Premium
Free with a 30 day trial!
Gain access to
- Unlimited Watchlists
- Advanced Search Filtering
- Fund Comparisons
- Portfolio Scenarios
- Customizable PDF Reports
- Portfolio Rebalancer new
Pender Strategic Growth and Income Fund Class A
Global Neutral Balanced
 Click for more information on Fundata’s FundGrade
FundGrade C
Click for more information on Fundata’s FundGrade.

FundGrade A+® Rating Recipient
2024, 2022, 2014
Click for more information on Fundata’s FundGrade
|
NAVPS (06-22-2026) |
$9.77 |
|---|---|
| Change |
-$0.06
(-0.56%)
|
As at May 31, 2026
As at May 31, 2026
Legend
Compare Options
Fund Returns
Inception Return (December 13, 2019): 8.40%
| Row Heading | Return | Annualized Return | ||||||||||||
|---|---|---|---|---|---|---|---|---|---|---|---|---|---|---|
| 1 Mth | 3 Mth | 6 Mth | YTD | 1 Yr | 2 Yr | 3 Yr | 4 Yr | 5 Yr | 6 Yr | 7 Yr | 8 Yr | 9 Yr | 10 Yr | |
| Fund | 3.18% | 1.90% | 5.55% | 4.60% | 15.61% | 10.07% | 13.13% | 9.27% | 6.73% | 14.10% | - | - | - | - |
| Benchmark | 4.15% | 4.24% | 6.13% | 7.49% | 17.74% | 14.74% | 14.02% | 11.92% | 8.11% | 8.14% | 8.14% | 7.77% | 7.25% | 7.84% |
| Category Average | 2.60% | 2.28% | 5.38% | 5.90% | 14.32% | 11.64% | 11.45% | 8.71% | 6.06% | 7.52% | 6.76% | 6.24% | 5.81% | 6.18% |
| Category Rank | 644 / 1,772 | 1,219 / 1,769 | 907 / 1,752 | 1,431 / 1,753 | 761 / 1,729 | 1,327 / 1,652 | 472 / 1,581 | 801 / 1,553 | 695 / 1,394 | 2 / 1,280 | - | - | - | - |
| Quartile Ranking | 2 | 3 | 3 | 4 | 2 | 4 | 2 | 3 | 2 | 1 | - | - | - | - |
Monthly Return
| Return % | Jun | Jul | Aug | Sep | Oct | Nov | Dec | Jan | Feb | Mar | Apr | May |
|---|---|---|---|---|---|---|---|---|---|---|---|---|
| Fund | 3.56% | -0.07% | 2.54% | 2.45% | 0.91% | -0.16% | 0.91% | 1.83% | 0.80% | -4.00% | 2.88% | 3.18% |
| Benchmark | 2.53% | 1.48% | 1.44% | 3.57% | 1.71% | -0.22% | -1.26% | 1.04% | 2.06% | -3.32% | 3.53% | 4.15% |
Best Monthly Return Since Inception
9.80% (November 2020)
Worst Monthly Return Since Inception
-28.51% (March 2020)
Calendar Return (%)
| Return % | 2016 | 2017 | 2018 | 2019 | 2020 | 2021 | 2022 | 2023 | 2024 | 2025 |
|---|---|---|---|---|---|---|---|---|---|---|
| Fund | - | - | - | - | -1.94% | 22.78% | -8.05% | 12.20% | 19.31% | 4.31% |
| Benchmark | 2.39% | 8.66% | 2.68% | 12.26% | 11.12% | 6.48% | -11.62% | 11.69% | 17.48% | 10.42% |
| Category Average | 5.05% | 7.69% | -3.99% | 13.52% | 7.16% | 9.69% | -11.26% | 9.53% | 12.15% | 9.84% |
| Quartile Ranking | - | - | - | - | 4 | 1 | 1 | 1 | 1 | 4 |
| Category Rank | - | - | - | - | 1,255/ 1,263 | 10/ 1,347 | 303/ 1,489 | 174/ 1,576 | 53/ 1,624 | 1,618/ 1,679 |
Best Calendar Return (Last 10 years)
22.78% (2021)
Worst Calendar Return (Last 10 years)
-8.05% (2022)
Asset Allocation
| Name | Percent |
|---|---|
| Foreign Corporate Bonds | 25.55 |
| Canadian Equity | 23.48 |
| US Equity | 14.22 |
| International Equity | 11.84 |
| Canadian Bonds - Other | 9.03 |
| Other | 15.88 |
Sector Allocation
| Name | Percent |
|---|---|
| Fixed Income | 44.80 |
| Financial Services | 13.25 |
| Technology | 8.92 |
| Consumer Goods | 7.05 |
| Healthcare | 5.10 |
| Other | 20.88 |
Geographic Allocation
| Name | Percent |
|---|---|
| North America | 82.21 |
| Europe | 11.95 |
| Asia | 3.06 |
| Latin America | 1.41 |
| Multi-National | 0.56 |
| Other | 0.81 |
Top Holdings
| Name | Percent |
|---|---|
| Pender Corporate Bond Fund Class A | 42.62 |
| Pender Small Cap Opportunities Fund Class A | 11.09 |
| PENDER AL AB RT CLO BNS 2030 | 9.03 |
| Brookfield Corp Cl A | 3.49 |
| Exor NV | 2.96 |
| Onex Corp | 2.72 |
| Maravai LifeSciences Holdings Inc Cl A | 2.57 |
| Trisura Group Ltd | 2.55 |
| Exchange Income Corp | 2.52 |
| Baidu Inc - ADR | 2.30 |
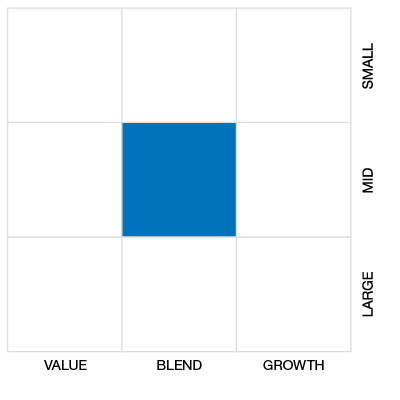
Equity Style
Fixed Income Style

Risk vs Return (3 Yr)
Pender Strategic Growth and Income Fund Class A
Median
Other - Global Neutral Balanced
3 Yr Annualized
| Standard Deviation | 8.46% | 9.06% | - |
|---|---|---|---|
| Beta | 1.01 | 0.88 | - |
| Alpha | -0.01 | 0.00 | - |
| Rsquared | 0.70% | 0.65% | - |
| Sharpe | 1.08 | 0.44 | - |
| Sortino | 2.01 | 0.66 | - |
| Treynor | 0.09 | 0.05 | - |
| Tax Efficiency | 95.86% | 84.45% | - |
| Volatility |

|
|
- |
Risk Rating

Annualized Key Ratio Period Comparison
| Key Ratio | 1 Yr | 3 Yr | 5 Yr | 10 Yr |
|---|---|---|---|---|
| Standard Deviation | 7.15% | 8.46% | 9.06% | - |
| Beta | 0.81 | 1.01 | 0.88 | - |
| Alpha | 0.01 | -0.01 | 0.00 | - |
| Rsquared | 0.72% | 0.70% | 0.65% | - |
| Sharpe | 1.75 | 1.08 | 0.44 | - |
| Sortino | 2.76 | 2.01 | 0.66 | - |
| Treynor | 0.15 | 0.09 | 0.05 | - |
| Tax Efficiency | 95.71% | 95.86% | 84.45% | - |
Fund Details
| Start Date | December 13, 2019 |
|---|---|
| Instrument Type | Mutual Fund |
| Share Class | Commission Based Advice |
| Legal Status | Trust |
| Sales Status | Capped |
| Currency | CAD |
| Distribution Frequency | Quarterly |
| Assets ($mil) | $53 |
Fund Codes
| FundServ Code | Load Code | Sales Status |
|---|---|---|
| PGF1000 |
Investment Objectives
The objective of the Fund is to generate long-term growth in value and income by investing in a diversified portfolio of Canadian and foreign equities, corporate bonds, Canadian and foreign government bonds, and exchange traded funds which track sector or broad market indices. It is designed to provide both moderate income and portfolio growth over the long-term, while being sufficiently diversified to mitigate volatility.
Investment Strategy
Asset Allocation - The Manager intends to maintain a targeted allocation of 20% to 80% in Canadian and foreign equities, with the balance being in fixed income and cash. The Fund invests in Canadian and foreign securities; up to 100% of the Fund may be invested in foreign securities. As part of its asset allocation process, the Manager may invest in Underlying Funds that are aligned with the Fund’s investment objectives and strategies.
Portfolio Management
| Portfolio Manager |
PenderFund Capital Management Ltd.
|
|---|---|
| Sub-Advisor |
- |
Management and Organization
| Fund Manager |
PenderFund Capital Management Ltd. |
|---|---|
| Custodian |
CIBC Mellon Trust Company |
| Registrar |
CIBC Mellon Trust Company |
| Distributor |
- |
Investment Minimums
| RSP Eligible | Yes |
|---|---|
| PAC Allowed | Yes |
| PAC Initial Investment | 0 |
| PAC Subsequent | 0 |
| SWP Allowed | No |
| SWP Min Balance | - |
| SWP Min Withdrawal | - |
Fees
| MER | 2.30% |
|---|---|
| Management Fee | 1.70% |
| Load | Back Fee Only |
| FE Max | 5.00% |
| DSC Max | - |
| Trailer Fee Max (FE) | 0.85% |
| Trailer Fee Max (DSC) | - |
| Trailer Fee Max (NL) | - |
| Trailer Fee Max (LL) | - |
Related articles
Try Fund Library Premium
Free with a 30 day trial!
Gain access to
- Unlimited Watchlists
- Advanced Search Filtering
- Fund Comparisons
- Portfolio Scenarios
- Customizable PDF Reports
- Portfolio Rebalancer new
