Try Fund Library Premium
Free with a 30 day trial!
Gain access to
- Unlimited Watchlists
- Advanced Search Filtering
- Fund Comparisons
- Portfolio Scenarios
- Customizable PDF Reports
- Portfolio Rebalancer new
Pender Alternative Special Situations Fund Class A
Alternative Equity Focus
 Click for more information on Fundata’s FundGrade
FundGrade B
Click for more information on Fundata’s FundGrade.
|
NAVPS (07-30-2026) |
$34.28 |
|---|---|
| Change |
$0.49
(1.45%)
|
As at June 30, 2026
As at June 30, 2026
Legend
Compare Options
Fund Returns
Inception Return (July 10, 2020): 30.15%
| Row Heading | Return | Annualized Return | ||||||||||||
|---|---|---|---|---|---|---|---|---|---|---|---|---|---|---|
| 1 Mth | 3 Mth | 6 Mth | YTD | 1 Yr | 2 Yr | 3 Yr | 4 Yr | 5 Yr | 6 Yr | 7 Yr | 8 Yr | 9 Yr | 10 Yr | |
| Fund | -3.45% | 6.59% | 12.40% | 12.40% | 42.93% | 30.97% | 30.57% | 24.15% | 16.81% | - | - | - | - | - |
| Benchmark | 0.50% | 6.96% | 11.16% | 11.16% | 32.87% | 29.58% | 23.48% | 20.08% | 14.85% | 17.82% | 14.73% | 13.31% | 12.99% | 12.79% |
| Category Average | 1.01% | 8.91% | 10.31% | 10.31% | 20.42% | 16.13% | 15.81% | 12.72% | 9.25% | 11.57% | 9.38% | - | - | - |
| Category Rank | 235 / 256 | 136 / 254 | 84 / 240 | 84 / 240 | 23 / 219 | 24 / 166 | 11 / 124 | 12 / 114 | 9 / 90 | - | - | - | - | - |
| Quartile Ranking | 4 | 3 | 2 | 2 | 1 | 1 | 1 | 1 | 1 | - | - | - | - | - |
Monthly Return
| Return % | Jul | Aug | Sep | Oct | Nov | Dec | Jan | Feb | Mar | Apr | May | Jun |
|---|---|---|---|---|---|---|---|---|---|---|---|---|
| Fund | 3.74% | 11.28% | 6.23% | 2.49% | -5.07% | 6.57% | 12.49% | 0.93% | -7.11% | 9.22% | 1.08% | -3.45% |
| Benchmark | 1.69% | 4.96% | 5.40% | 0.97% | 3.86% | 1.32% | 0.84% | 7.72% | -4.32% | 3.81% | 2.52% | 0.50% |
Best Monthly Return Since Inception
15.87% (November 2020)
Worst Monthly Return Since Inception
-12.44% (September 2022)
Calendar Return (%)
| Return % | 2016 | 2017 | 2018 | 2019 | 2020 | 2021 | 2022 | 2023 | 2024 | 2025 |
|---|---|---|---|---|---|---|---|---|---|---|
| Fund | - | - | - | - | - | 37.10% | -16.46% | 23.00% | 27.15% | 36.84% |
| Benchmark | 21.08% | 9.10% | -8.89% | 22.88% | 5.60% | 25.09% | -5.84% | 11.75% | 21.65% | 31.68% |
| Category Average | - | - | - | - | 5.11% | 17.27% | -5.96% | 6.54% | 16.58% | 15.40% |
| Quartile Ranking | - | - | - | - | - | 1 | 4 | 1 | 2 | 1 |
| Category Rank | - | - | - | - | - | 3/ 81 | 80/ 103 | 20/ 118 | 41/ 139 | 16/ 190 |
Best Calendar Return (Last 10 years)
37.10% (2021)
Worst Calendar Return (Last 10 years)
-16.46% (2022)
Asset Allocation
| Name | Percent |
|---|---|
| Canadian Equity | 104.47 |
| Foreign Corporate Bonds | 3.54 |
| Income Trust Units | 2.56 |
| Canadian Corporate Bonds | 0.28 |
| Cash and Equivalents | -0.04 |
| Other | -10.81 |
Sector Allocation
| Name | Percent |
|---|---|
| Basic Materials | 33.84 |
| Energy | 13.39 |
| Industrial Goods | 12.25 |
| Telecommunications | 6.01 |
| Consumer Goods | 5.38 |
| Other | 29.13 |
Geographic Allocation
| Name | Percent |
|---|---|
| North America | 98.79 |
| Latin America | 1.87 |
| Africa and Middle East | -0.01 |
| Asia | -0.05 |
| Europe | -0.56 |
| Other | -0.04 |
Top Holdings
| Name | Percent |
|---|---|
| CARRIER CONNECT DATA SOLUTIO COM | 7.93 |
| BLUE MOON METALS INC | 7.15 |
| Telesat Corp Cl A | 6.36 |
| MDA Space Ltd | 5.71 |
| Nexgen Energy Ltd | 4.97 |
| Kraken Robotics Inc | 4.32 |
| Isoenergy Ltd | 4.10 |
| Logan Energy Corp | 4.00 |
| Neo Performance Materials Inc | 3.97 |
| 5N Plus Inc | 3.64 |
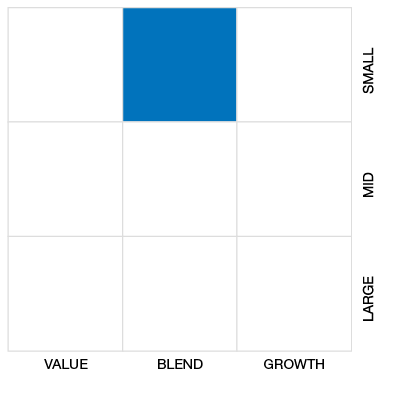
Equity Style
Fixed Income Style

Risk vs Return (3 Yr)
Pender Alternative Special Situations Fund Class A
Median
Other - Alternative Equity Focus
3 Yr Annualized
| Standard Deviation | 18.95% | 19.89% | - |
|---|---|---|---|
| Beta | 0.78 | 0.87 | - |
| Alpha | 0.12 | 0.05 | - |
| Rsquared | 0.20% | 0.30% | - |
| Sharpe | 1.33 | 0.74 | - |
| Sortino | 2.43 | 1.20 | - |
| Treynor | 0.32 | 0.17 | - |
| Tax Efficiency | 98.99% | - | - |
| Volatility |

|
|
- |
Risk Rating

Annualized Key Ratio Period Comparison
| Key Ratio | 1 Yr | 3 Yr | 5 Yr | 10 Yr |
|---|---|---|---|---|
| Standard Deviation | 21.85% | 18.95% | 19.89% | - |
| Beta | 0.76 | 0.78 | 0.87 | - |
| Alpha | 0.16 | 0.12 | 0.05 | - |
| Rsquared | 0.14% | 0.20% | 0.30% | - |
| Sharpe | 1.65 | 1.33 | 0.74 | - |
| Sortino | 3.61 | 2.43 | 1.20 | - |
| Treynor | 0.47 | 0.32 | 0.17 | - |
| Tax Efficiency | 99.92% | 98.99% | - | - |
Fund Details
| Start Date | July 10, 2020 |
|---|---|
| Instrument Type | Mutual Fund (Alternative) |
| Share Class | Commission Based Advice |
| Legal Status | - |
| Sales Status | Open |
| Currency | CAD |
| Distribution Frequency | Annual |
| Assets ($mil) | - |
Fund Codes
| FundServ Code | Load Code | Sales Status |
|---|---|---|
| PGF1500 |
Investment Objectives
The Fund’s objective is to achieve long-term capital appreciation by investing primarily in Canadian and US equities with the ability to also invest in debt and other securities. The Fund seeks to identify investment opportunities that are believed to represent special situations.
Investment Strategy
The investment strategies of the Fund are as described below. The Fund aims to identify investment opportunities that it believes represents special situations, which are investments that may realize a revaluation, the potential for which has not been reflected by the market. This includes seeking to capitalize on changes in fundamentals, sentiment or momentum for companies and industries.
Portfolio Management
| Portfolio Manager |
PenderFund Capital Management Ltd.
|
|---|---|
| Sub-Advisor |
- |
Management and Organization
| Fund Manager |
PenderFund Capital Management Ltd. |
|---|---|
| Custodian |
The Bank of Nova Scotia |
| Registrar |
CIBC Mellon Trust Company |
| Distributor |
- |
Investment Minimums
| RSP Eligible | Yes |
|---|---|
| PAC Allowed | Yes |
| PAC Initial Investment | 0 |
| PAC Subsequent | 0 |
| SWP Allowed | No |
| SWP Min Balance | - |
| SWP Min Withdrawal | - |
Fees
| MER | 0.00% |
|---|---|
| Management Fee | 2.10% |
| Load | Back Fee Only |
| FE Max | 5.00% |
| DSC Max | - |
| Trailer Fee Max (FE) | 1.00% |
| Trailer Fee Max (DSC) | - |
| Trailer Fee Max (NL) | - |
| Trailer Fee Max (LL) | - |
Try Fund Library Premium
Free with a 30 day trial!
Gain access to
- Unlimited Watchlists
- Advanced Search Filtering
- Fund Comparisons
- Portfolio Scenarios
- Customizable PDF Reports
- Portfolio Rebalancer new
