Try Fund Library Premium
For Free with a 30 day trial!
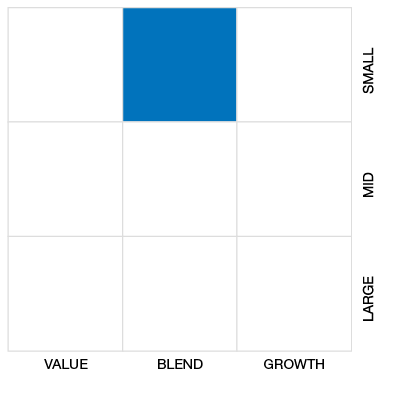
Cdn Small/Mid Cap Equity
 Click for more information on Fundata’s FundGrade
Click for more information on Fundata’s FundGrade.
|
NAVPS (10-07-2025) |
$46.09 |
|---|---|
| Change |
-$0.35
(-0.75%)
|
As at August 31, 2025
As at July 31, 2025
Inception Return (March 27, 1986): 9.26%
| Row Heading | Return | Annualized Return | ||||||||||||
|---|---|---|---|---|---|---|---|---|---|---|---|---|---|---|
| 1 Mth | 3 Mth | 6 Mth | YTD | 1 Yr | 2 Yr | 3 Yr | 4 Yr | 5 Yr | 6 Yr | 7 Yr | 8 Yr | 9 Yr | 10 Yr | |
| Fund | 8.79% | 11.87% | 20.86% | 13.77% | 18.64% | 15.63% | 13.51% | 4.15% | 8.50% | 8.20% | 5.06% | 5.62% | 5.13% | 5.92% |
| Benchmark | 9.34% | 17.84% | 27.19% | 25.11% | 30.76% | 22.19% | 16.21% | 9.82% | 14.91% | 12.07% | 9.41% | 8.66% | 7.93% | 9.32% |
| Category Average | 4.26% | 9.94% | 15.90% | 12.96% | 17.61% | 16.35% | 12.24% | 5.79% | 11.72% | 10.38% | 7.72% | 7.61% | 6.93% | 7.27% |
| Category Rank | 10 / 201 | 76 / 201 | 32 / 200 | 84 / 200 | 104 / 200 | 131 / 196 | 77 / 196 | 116 / 193 | 161 / 180 | 149 / 177 | 148 / 170 | 138 / 166 | 133 / 158 | 110 / 136 |
| Quartile Ranking | 1 | 2 | 1 | 2 | 3 | 3 | 2 | 3 | 4 | 4 | 4 | 4 | 4 | 4 |
| Return % | Sep | Oct | Nov | Dec | Jan | Feb | Mar | Apr | May | Jun | Jul | Aug |
|---|---|---|---|---|---|---|---|---|---|---|---|---|
| Fund | 1.63% | 2.50% | 3.39% | -3.18% | -1.15% | -4.77% | 3.82% | -2.50% | 6.73% | 2.75% | 0.08% | 8.79% |
| Benchmark | 3.80% | 1.39% | 2.69% | -3.30% | 0.65% | -2.27% | 2.56% | -1.83% | 7.20% | 6.19% | 1.50% | 9.34% |
17.80% (April 2020)
-29.81% (October 1987)
| Return % | 2015 | 2016 | 2017 | 2018 | 2019 | 2020 | 2021 | 2022 | 2023 | 2024 |
|---|---|---|---|---|---|---|---|---|---|---|
| Fund | -10.77% | 18.49% | 5.64% | -17.96% | 14.84% | 8.74% | 13.10% | -14.48% | 9.01% | 17.31% |
| Benchmark | -13.31% | 38.48% | 2.75% | -18.17% | 15.84% | 12.87% | 20.27% | -9.29% | 4.79% | 18.83% |
| Category Average | -6.13% | 18.01% | 3.43% | -15.15% | 16.59% | 11.91% | 22.35% | -11.32% | 6.49% | 16.84% |
| Quartile Ranking | 4 | 3 | 2 | 4 | 4 | 3 | 4 | 3 | 2 | 3 |
| Category Rank | 118/ 131 | 95/ 153 | 54/ 158 | 128/ 167 | 148/ 174 | 129/ 179 | 184/ 186 | 117/ 194 | 74/ 196 | 103/ 197 |
18.49% (2016)
-17.96% (2018)
| Name | Percent |
|---|---|
| Canadian Equity | 83.66 |
| Income Trust Units | 6.15 |
| International Equity | 4.91 |
| Cash and Equivalents | 3.16 |
| US Equity | 2.12 |
| Name | Percent |
|---|---|
| Basic Materials | 33.32 |
| Energy | 15.86 |
| Consumer Goods | 9.52 |
| Real Estate | 8.74 |
| Healthcare | 5.81 |
| Other | 26.75 |
| Name | Percent |
|---|---|
| North America | 95.10 |
| Asia | 4.23 |
| Europe | 0.36 |
| Latin America | 0.32 |
| Name | Percent |
|---|---|
| Dundee Precious Metals Inc | 3.70 |
| Maple Leaf Foods Inc | 3.30 |
| Canadian Dollar | 3.11 |
| OceanaGold Corp | 2.80 |
| Chemtrade Logistics Income Fund - Units | 2.65 |
| Tamarack Valley Energy Ltd | 2.57 |
| Aris Mining Corp | 2.43 |
| Pet Valu Holdings Ltd | 2.32 |
| MDA Space Ltd | 2.25 |
| Badger Infrastructure Solutions Ltd | 2.21 |

NEI Canadian Small Cap Equity Fund Series A
Median
Other - Cdn Small/Mid Cap Equity
| Standard Deviation | 12.26% | 13.84% | 15.55% |
|---|---|---|---|
| Beta | 0.79% | 0.67% | 0.68% |
| Alpha | 0.01% | -0.01% | 0.00% |
| Rsquared | 0.85% | 0.68% | 0.76% |
| Sharpe | 0.77% | 0.47% | 0.34% |
| Sortino | 1.52% | 0.69% | 0.36% |
| Treynor | 0.12% | 0.10% | 0.08% |
| Tax Efficiency | 90.30% | 90.90% | 87.33% |
| Volatility |

|

|

|

| Key Ratio | 1 Yr | 3 Yr | 5 Yr | 10 Yr |
|---|---|---|---|---|
| Standard Deviation | 13.94% | 12.26% | 13.84% | 15.55% |
| Beta | 0.97% | 0.79% | 0.67% | 0.68% |
| Alpha | -0.09% | 0.01% | -0.01% | 0.00% |
| Rsquared | 0.87% | 0.85% | 0.68% | 0.76% |
| Sharpe | 1.08% | 0.77% | 0.47% | 0.34% |
| Sortino | 2.21% | 1.52% | 0.69% | 0.36% |
| Treynor | 0.16% | 0.12% | 0.10% | 0.08% |
| Tax Efficiency | 91.71% | 90.30% | 90.90% | 87.33% |
| Start Date | March 27, 1986 |
|---|---|
| Instrument Type | Mutual Fund (Responsible Investment) |
| Share Class | Commission Based Advice |
| Legal Status | Trust |
| Sales Status | Open |
| Currency | CAD |
| Distribution Frequency | Annual |
| Assets ($mil) | $56 |
| FundServ Code | Load Code | Sales Status |
|---|---|---|
| NWT10118 |
The Fund aims to achieve capital appreciation over the longer term by seeking to invest primarily in the equity securities of faster growing, small-cap Canadian companies. Unitholder approval (by a majority of votes cast at a meeting of unitholders) is required prior to a fundamental change of investment objectives.
The Portfolio Sub-Advisor uses a bottom up investing approach to achieve long-term growth of capital through investment in Canadian corporations or Canadian listed corporations. The Portfolio Sub-Advisor generally seeks to identify small or mid-capitalization companies with sustainable competitive advantages, strong balance sheets, high quality management teams, and then tries to acquire these companies at reasonable valuations.
| Portfolio Manager |
Northwest & Ethical Investments L.P.
|
|---|---|
| Sub-Advisor |
Hillsdale Investment Management Inc. |
| Fund Manager |
Northwest & Ethical Investments L.P. |
|---|---|
| Custodian |
Desjardins Trust Inc. |
| Registrar |
Northwest & Ethical Investments L.P. |
| Distributor |
Aviso Financial Inc. |
| RSP Eligible | Yes |
|---|---|
| PAC Allowed | Yes |
| PAC Initial Investment | 500 |
| PAC Subsequent | 25 |
| SWP Allowed | Yes |
| SWP Min Balance | 5,000 |
| SWP Min Withdrawal | 100 |
| MER | 2.59% |
|---|---|
| Management Fee | 1.95% |
| Load | Back Fee Only |
| FE Max | 5.00% |
| DSC Max | - |
| Trailer Fee Max (FE) | 0.75% |
| Trailer Fee Max (DSC) | - |
| Trailer Fee Max (NL) | - |
| Trailer Fee Max (LL) | - |
Try Fund Library Premium
For Free with a 30 day trial!
 Fund Library