Try Fund Library Premium
Free with a 30 day trial!
Gain access to
- Unlimited Watchlists
- Advanced Search Filtering
- Fund Comparisons
- Portfolio Scenarios
- Customizable PDF Reports
- Portfolio Rebalancer new
U.S. Equity Small Cap Corporate Class Series A
U.S. Small/Mid Cap Equity
 Click for more information on Fundata’s FundGrade
FundGrade B
Click for more information on Fundata’s FundGrade.
|
NAVPS (06-23-2026) |
$23.98 |
|---|---|
| Change |
$0.03
(0.14%)
|
As at May 31, 2026
As at May 31, 2026
Legend
Compare Options
Fund Returns
Inception Return (October 02, 2007): 7.17%
| Row Heading | Return | Annualized Return | ||||||||||||
|---|---|---|---|---|---|---|---|---|---|---|---|---|---|---|
| 1 Mth | 3 Mth | 6 Mth | YTD | 1 Yr | 2 Yr | 3 Yr | 4 Yr | 5 Yr | 6 Yr | 7 Yr | 8 Yr | 9 Yr | 10 Yr | |
| Fund | 4.73% | 6.67% | 12.36% | 13.67% | 35.40% | 15.83% | 14.27% | 8.14% | 4.90% | 11.45% | 9.04% | 6.45% | 6.35% | 7.32% |
| Benchmark | 5.62% | 8.10% | 14.60% | 14.88% | 31.10% | 18.56% | 20.20% | 15.39% | 10.94% | 14.65% | 12.38% | 10.82% | 10.89% | 11.75% |
| Category Average | 1.28% | 0.45% | 3.03% | 4.68% | 13.21% | 6.93% | 10.19% | 6.99% | 3.72% | 8.39% | 6.24% | 5.00% | 5.41% | 6.34% |
| Category Rank | 53 / 311 | 60 / 308 | 59 / 308 | 65 / 308 | 50 / 283 | 35 / 251 | 60 / 246 | 90 / 239 | 85 / 228 | 61 / 209 | 62 / 181 | 88 / 170 | 84 / 157 | 79 / 144 |
| Quartile Ranking | 1 | 1 | 1 | 1 | 1 | 1 | 1 | 2 | 2 | 2 | 2 | 3 | 3 | 3 |
Monthly Return
| Return % | Jun | Jul | Aug | Sep | Oct | Nov | Dec | Jan | Feb | Mar | Apr | May |
|---|---|---|---|---|---|---|---|---|---|---|---|---|
| Fund | 3.19% | 1.27% | 9.74% | 3.92% | -1.89% | 3.06% | -1.15% | 3.36% | 3.09% | -3.37% | 5.40% | 4.73% |
| Benchmark | 3.68% | 3.25% | 2.29% | 2.31% | 0.93% | 1.19% | -0.25% | 1.73% | 4.47% | -3.42% | 5.98% | 5.62% |
Best Monthly Return Since Inception
15.51% (November 2020)
Worst Monthly Return Since Inception
-23.01% (March 2020)
Calendar Return (%)
| Return % | 2016 | 2017 | 2018 | 2019 | 2020 | 2021 | 2022 | 2023 | 2024 | 2025 |
|---|---|---|---|---|---|---|---|---|---|---|
| Fund | 13.68% | 7.07% | -12.57% | 15.59% | 11.05% | 25.45% | -18.00% | 8.47% | 11.47% | 4.97% |
| Benchmark | 14.08% | 8.66% | -2.87% | 21.65% | 11.78% | 20.00% | -11.77% | 13.76% | 24.39% | 7.19% |
| Category Average | 9.80% | 10.84% | -7.63% | 15.90% | 4.61% | 23.16% | -17.30% | 11.64% | 13.19% | 1.07% |
| Quartile Ranking | 2 | 3 | 4 | 4 | 3 | 2 | 3 | 3 | 3 | 1 |
| Category Rank | 47/ 143 | 108/ 146 | 161/ 166 | 149/ 177 | 105/ 184 | 69/ 228 | 143/ 234 | 145/ 246 | 150/ 250 | 66/ 279 |
Best Calendar Return (Last 10 years)
25.45% (2021)
Worst Calendar Return (Last 10 years)
-18.00% (2022)
Asset Allocation
| Name | Percent |
|---|---|
| US Equity | 89.97 |
| International Equity | 8.84 |
| Canadian Equity | 1.48 |
| Cash and Equivalents | -0.29 |
Sector Allocation
| Name | Percent |
|---|---|
| Technology | 17.74 |
| Healthcare | 15.98 |
| Financial Services | 13.26 |
| Industrial Goods | 11.69 |
| Real Estate | 8.20 |
| Other | 33.13 |
Geographic Allocation
| Name | Percent |
|---|---|
| North America | 91.16 |
| Latin America | 4.50 |
| Europe | 3.78 |
| Africa and Middle East | 0.50 |
| Asia | 0.07 |
| Other | -0.01 |
Top Holdings
| Name | Percent |
|---|---|
| Sanmina Corp | 1.72 |
| ACM Research Inc Cl A | 1.37 |
| SM Energy Co | 1.23 |
| EnerSys | 1.21 |
| Penguin Solutions Inc | 1.17 |
| Coeur Mining Inc | 1.17 |
| Ultra Clean Holdings Inc | 1.08 |
| Portland General Electric Co | 1.07 |
| SSR Mining Inc | 1.07 |
| Apple Hospitality REIT Inc | 1.06 |
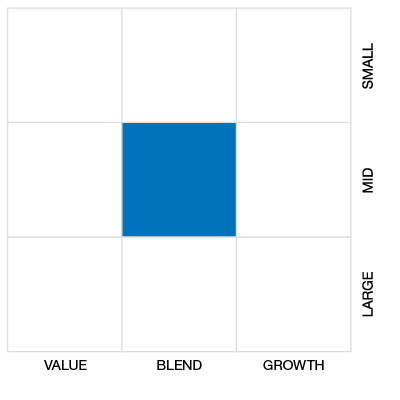
Equity Style
Fixed Income Style

Risk vs Return (3 Yr)
U.S. Equity Small Cap Corporate Class Series A
Median
Other - U.S. Small/Mid Cap Equity
3 Yr Annualized
| Standard Deviation | 17.01% | 17.98% | 18.74% |
|---|---|---|---|
| Beta | 0.99 | 1.02 | 1.08 |
| Alpha | -0.05 | -0.06 | -0.05 |
| Rsquared | 0.79% | 0.84% | 0.88% |
| Sharpe | 0.66 | 0.19 | 0.37 |
| Sortino | 1.18 | 0.29 | 0.46 |
| Treynor | 0.11 | 0.03 | 0.06 |
| Tax Efficiency | 94.76% | 81.35% | 85.77% |
| Volatility |

|
|
|
Risk Rating

Annualized Key Ratio Period Comparison
| Key Ratio | 1 Yr | 3 Yr | 5 Yr | 10 Yr |
|---|---|---|---|---|
| Standard Deviation | 12.28% | 17.01% | 17.98% | 18.74% |
| Beta | 0.90 | 0.99 | 1.02 | 1.08 |
| Alpha | 0.07 | -0.05 | -0.06 | -0.05 |
| Rsquared | 0.43% | 0.79% | 0.84% | 0.88% |
| Sharpe | 2.36 | 0.66 | 0.19 | 0.37 |
| Sortino | 6.40 | 1.18 | 0.29 | 0.46 |
| Treynor | 0.32 | 0.11 | 0.03 | 0.06 |
| Tax Efficiency | 97.20% | 94.76% | 81.35% | 85.77% |
Fund Details
| Start Date | October 02, 2007 |
|---|---|
| Instrument Type | Mutual Fund |
| Share Class | Commission Based Advice |
| Legal Status | Corporation |
| Sales Status | Open |
| Currency | CAD |
| Distribution Frequency | Quarterly |
| Assets ($mil) | $391 |
Fund Codes
| FundServ Code | Load Code | Sales Status |
|---|---|---|
| CIG17570 | ||
| CIG17670 | ||
| CIG17770 | ||
| CIG17870 |
Investment Objectives
The primary investment objective of the US Equity Small Cap Corporate Class is to obtain maximum long-term capital growth through direct and indirect investments in equity and equity-related securities of small to mid-market capitalization US companies that the portfolio adviser believes have the potential for positive total return. This fund also may invest in other mutual funds.
Investment Strategy
The portfolio adviser may use techniques such as fundamental analysis to assess the value and growth potential of a company. This means evaluating the financial condition and management of a company, its industry and the overall economy. As part of this evaluation, the portfolio adviser: analyzes financial data and other information sources; assesses the quality of management; conducts company interviews, where possible.
Portfolio Management
| Portfolio Manager |
CI Global Asset Management |
|---|---|
| Sub-Advisor |
CI Segall Bryant & Hamill Asset Management
|
Management and Organization
| Fund Manager |
CI Global Asset Management |
|---|---|
| Custodian |
RBC Investor Services Trust (Canada) |
| Registrar |
CI Global Asset Management |
| Distributor |
Assante Capital Management Ltd. Assante Financial Management Ltd |
Investment Minimums
| RSP Eligible | Yes |
|---|---|
| PAC Allowed | Yes |
| PAC Initial Investment | 50 |
| PAC Subsequent | 50 |
| SWP Allowed | Yes |
| SWP Min Balance | 5,000 |
| SWP Min Withdrawal | 50 |
Fees
| MER | 2.91% |
|---|---|
| Management Fee | 2.50% |
| Load | Choice of Front or No Load |
| FE Max | 4.00% |
| DSC Max | 5.50% |
| Trailer Fee Max (FE) | 1.00% |
| Trailer Fee Max (DSC) | 1.00% |
| Trailer Fee Max (NL) | - |
| Trailer Fee Max (LL) | - |
Try Fund Library Premium
Free with a 30 day trial!
Gain access to
- Unlimited Watchlists
- Advanced Search Filtering
- Fund Comparisons
- Portfolio Scenarios
- Customizable PDF Reports
- Portfolio Rebalancer new
